Search expressions
Search expressions
-
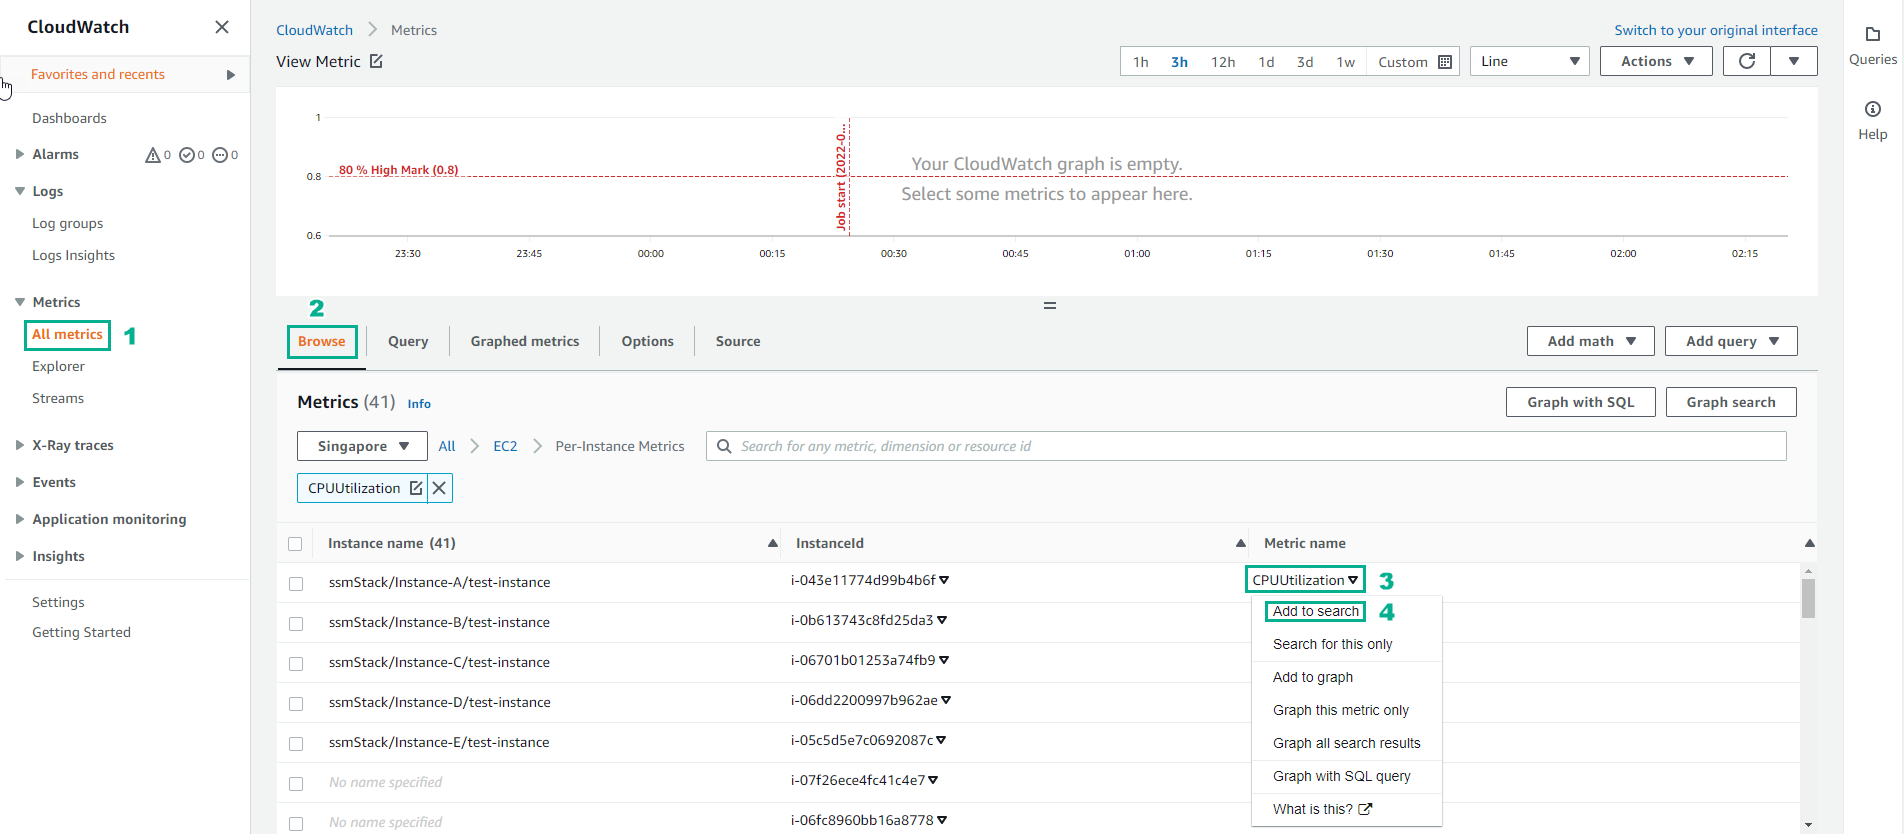
Like the previous part we access CloudWatch
- Select All metrics
- Select Browse
- Select EC2.
- Select Per-Instance Metrics
- Select CPUUtilization
- Select Add to search
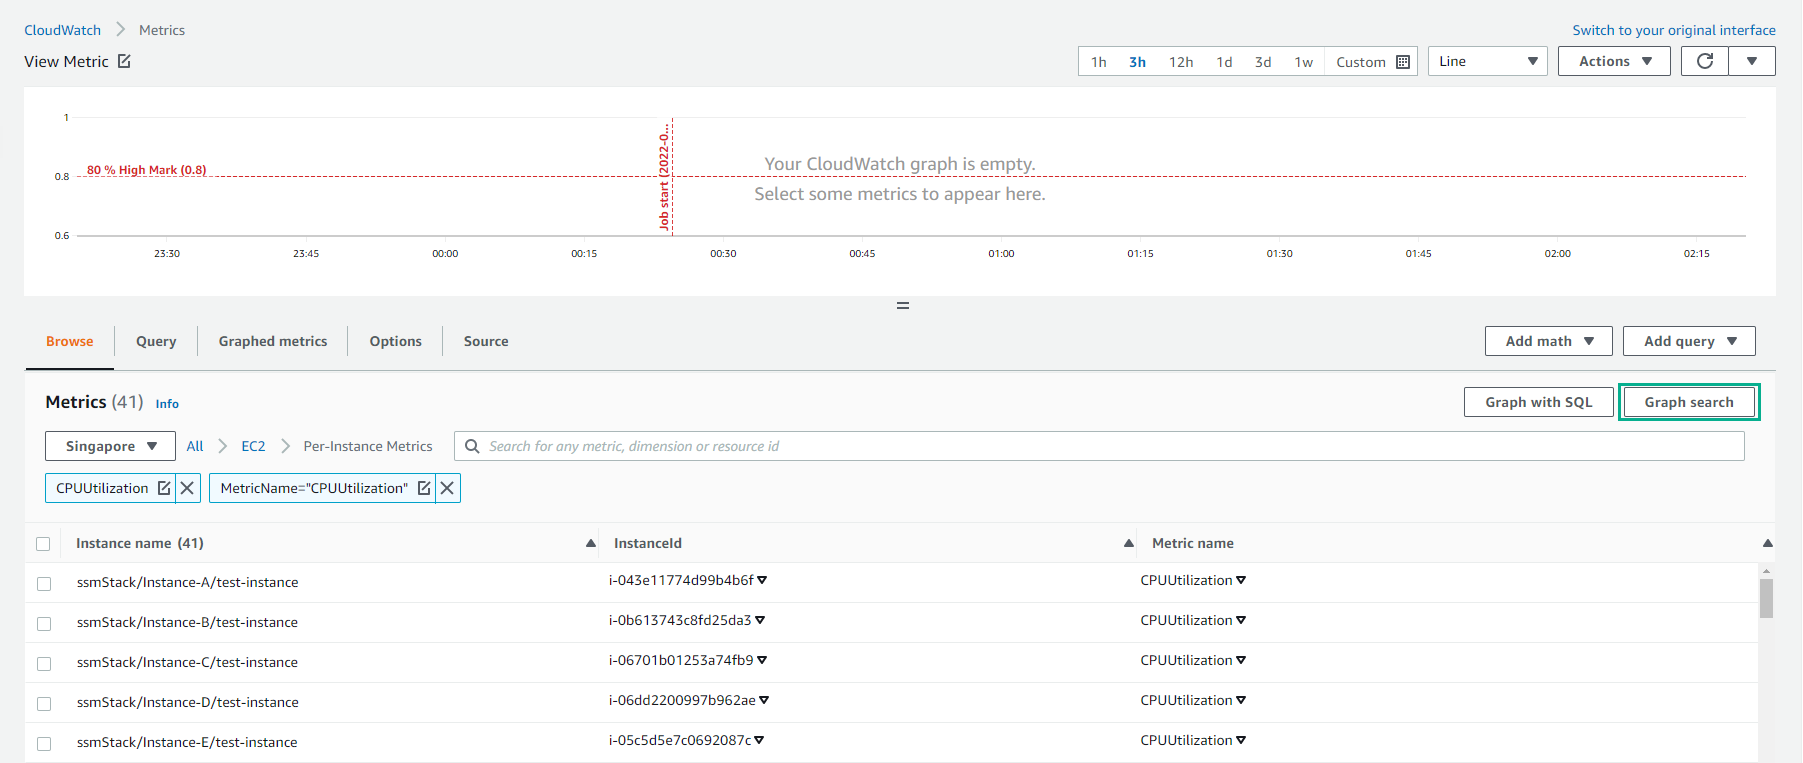
- Select Graph search
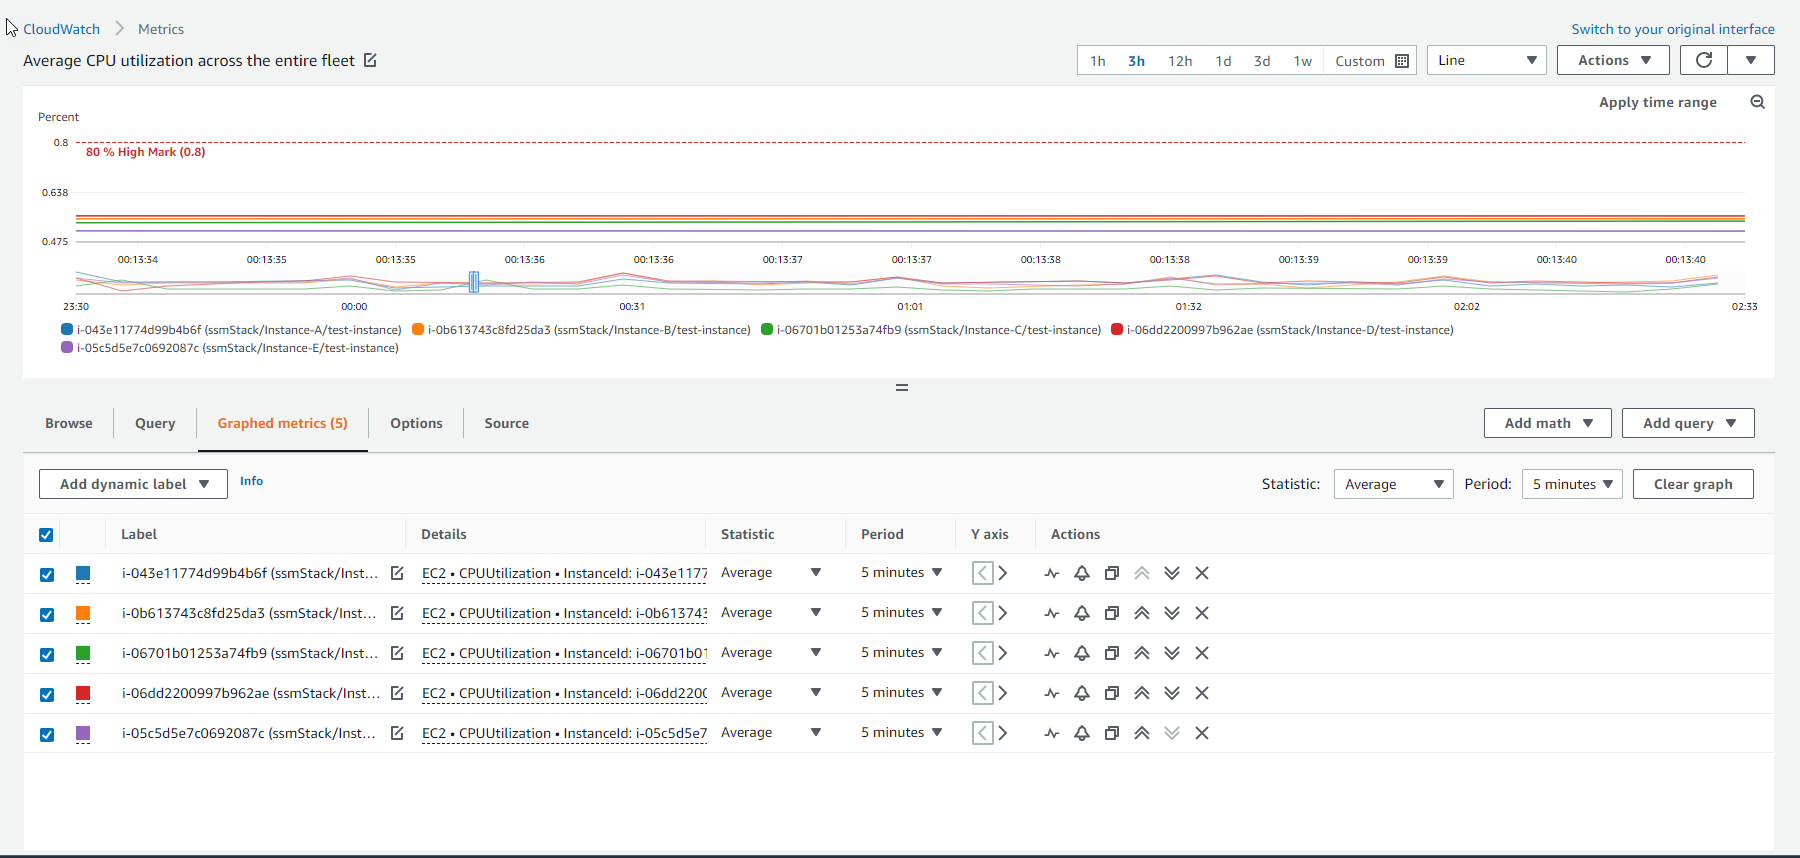
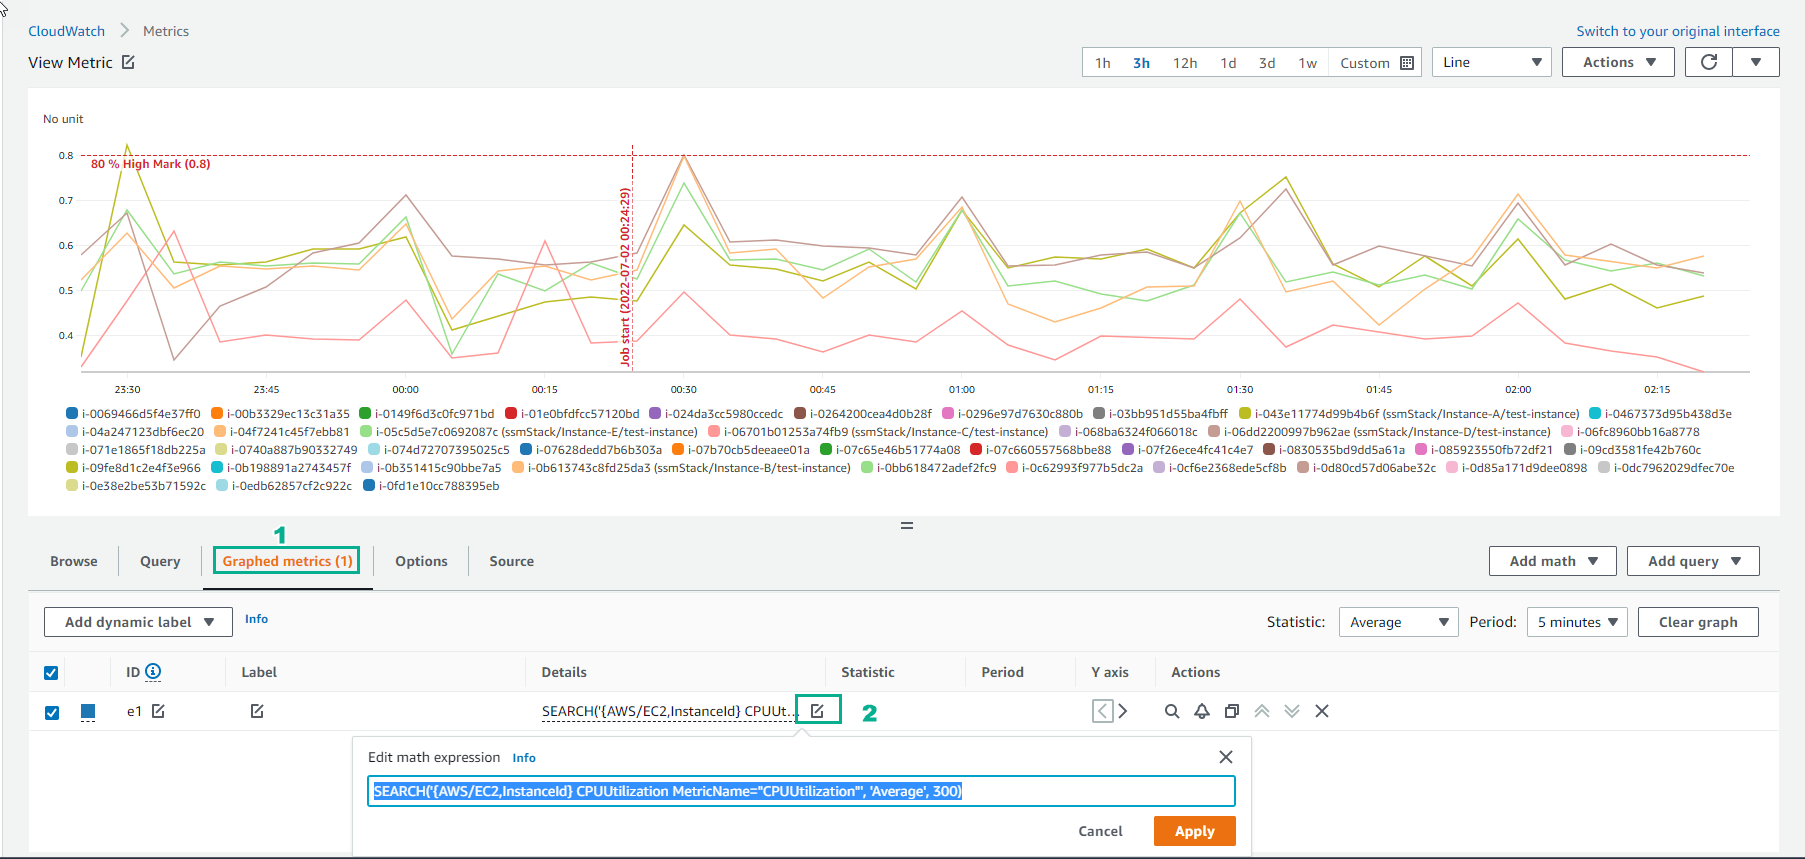
- Observe and select Graphed metrics
The details of the syntax are as follows:
SEARCH('{AWS/EC2,InstanceId} MetricName="CPUUtilization"', 'Average', 300)
- Continue practicing with the following syntaxes
SEARCH('{CWAgent,ImageId,InstanceId,InstanceType,device,fstype,path} path="/" MetricName="disk_used_percent"', 'Average', 300)
SEARCH('"disk_used_percent"', 'Average', 300)
SEARCH('used', 'Average', 300)