CloudWatch Dashboards
Amazon CloudWatch Dashboards
ℹ️ Information: CloudWatch Dashboards provide a customizable home page in the CloudWatch console that you can use to monitor your resources across multiple regions. Dashboards allow you to create a unified view of the metrics and alarms that matter most to your operations.
In this final section of the workshop, we’ll create a comprehensive dashboard to visualize the metrics and alarms we’ve configured throughout the previous modules, with special focus on the error log monitoring we established.
-
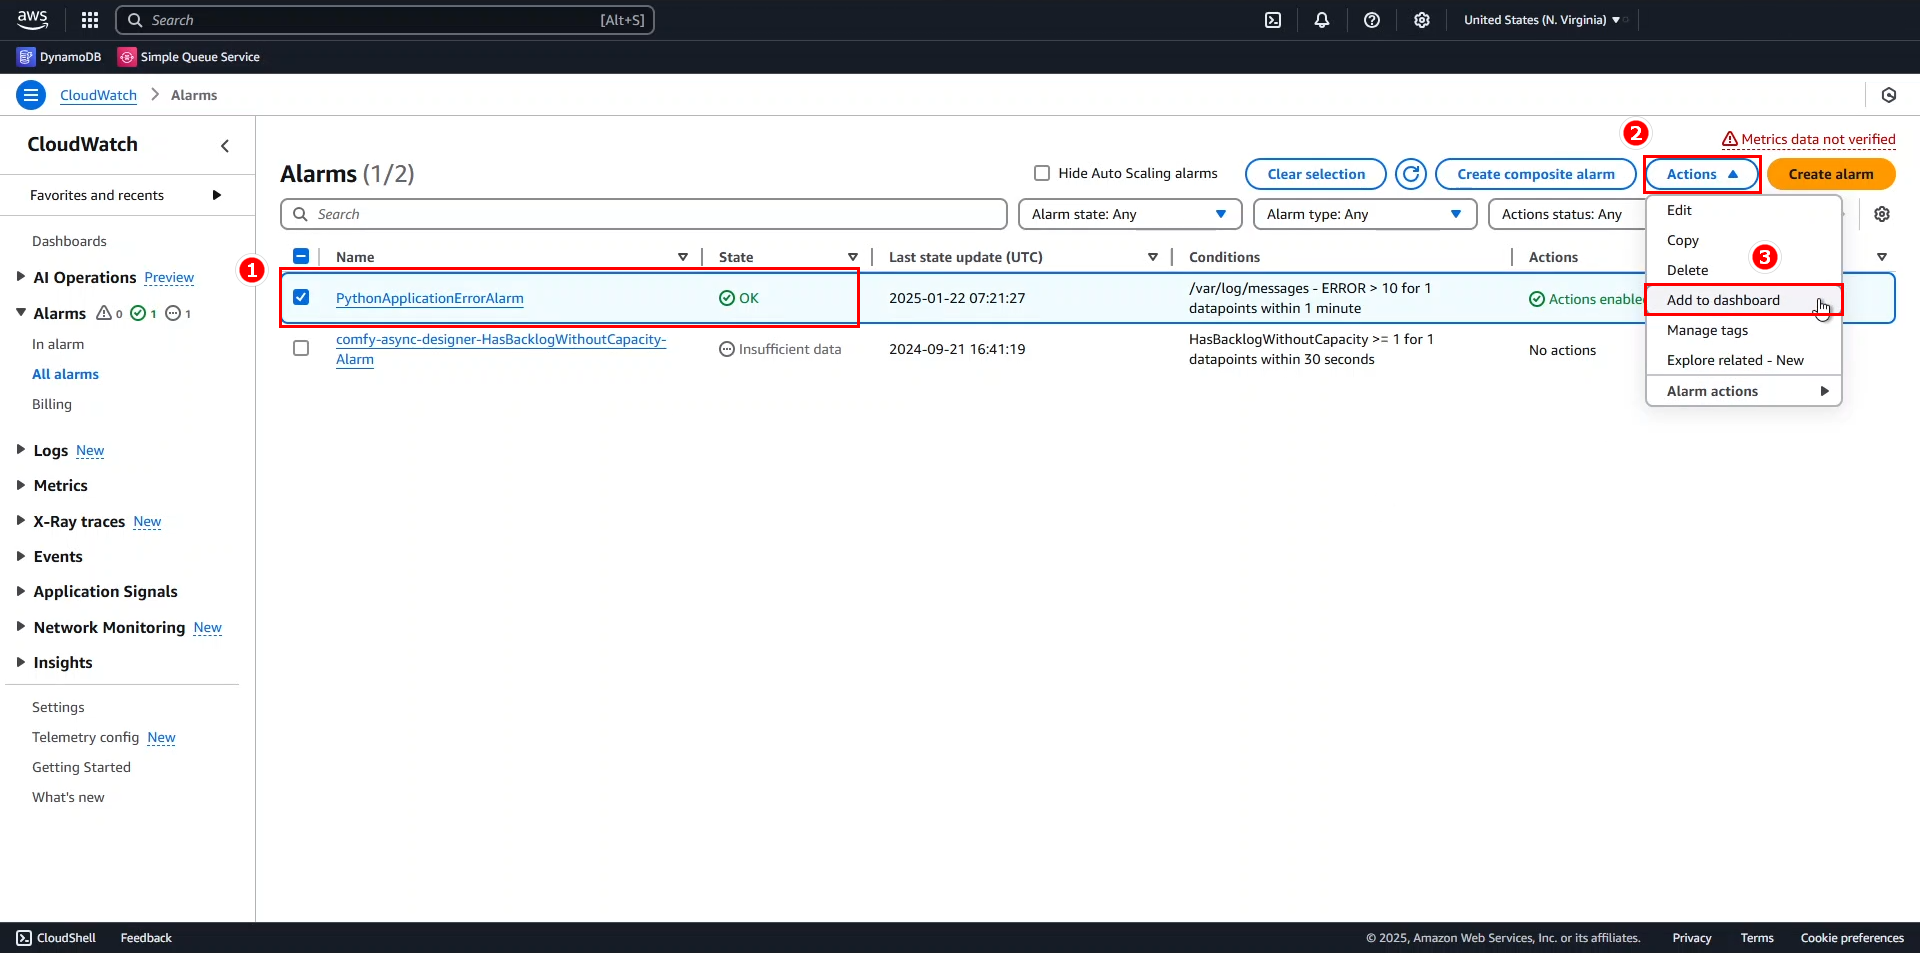
Add the alarm we created to the dashboard:
- Select PythonApplicationErrorAlarm
- Expand Actions
- Select Add to dashboard
-
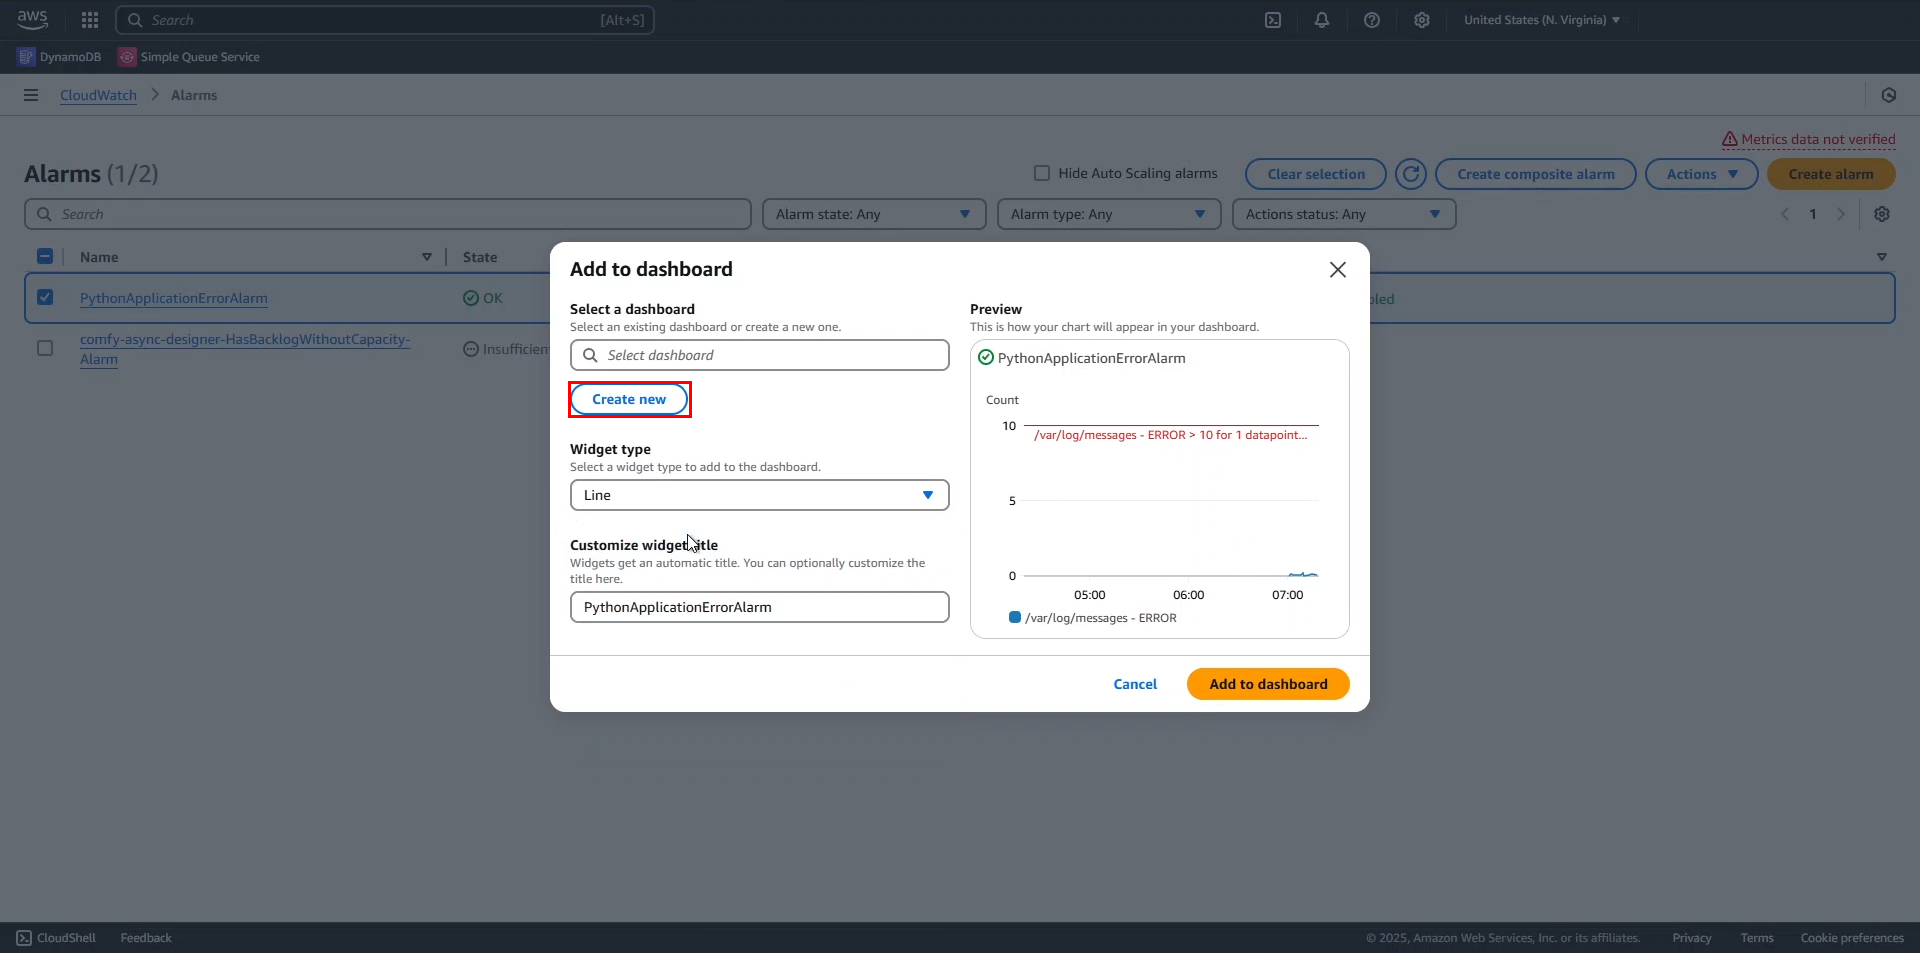
In the Add to dashboard dialog:
- Select Create new
-
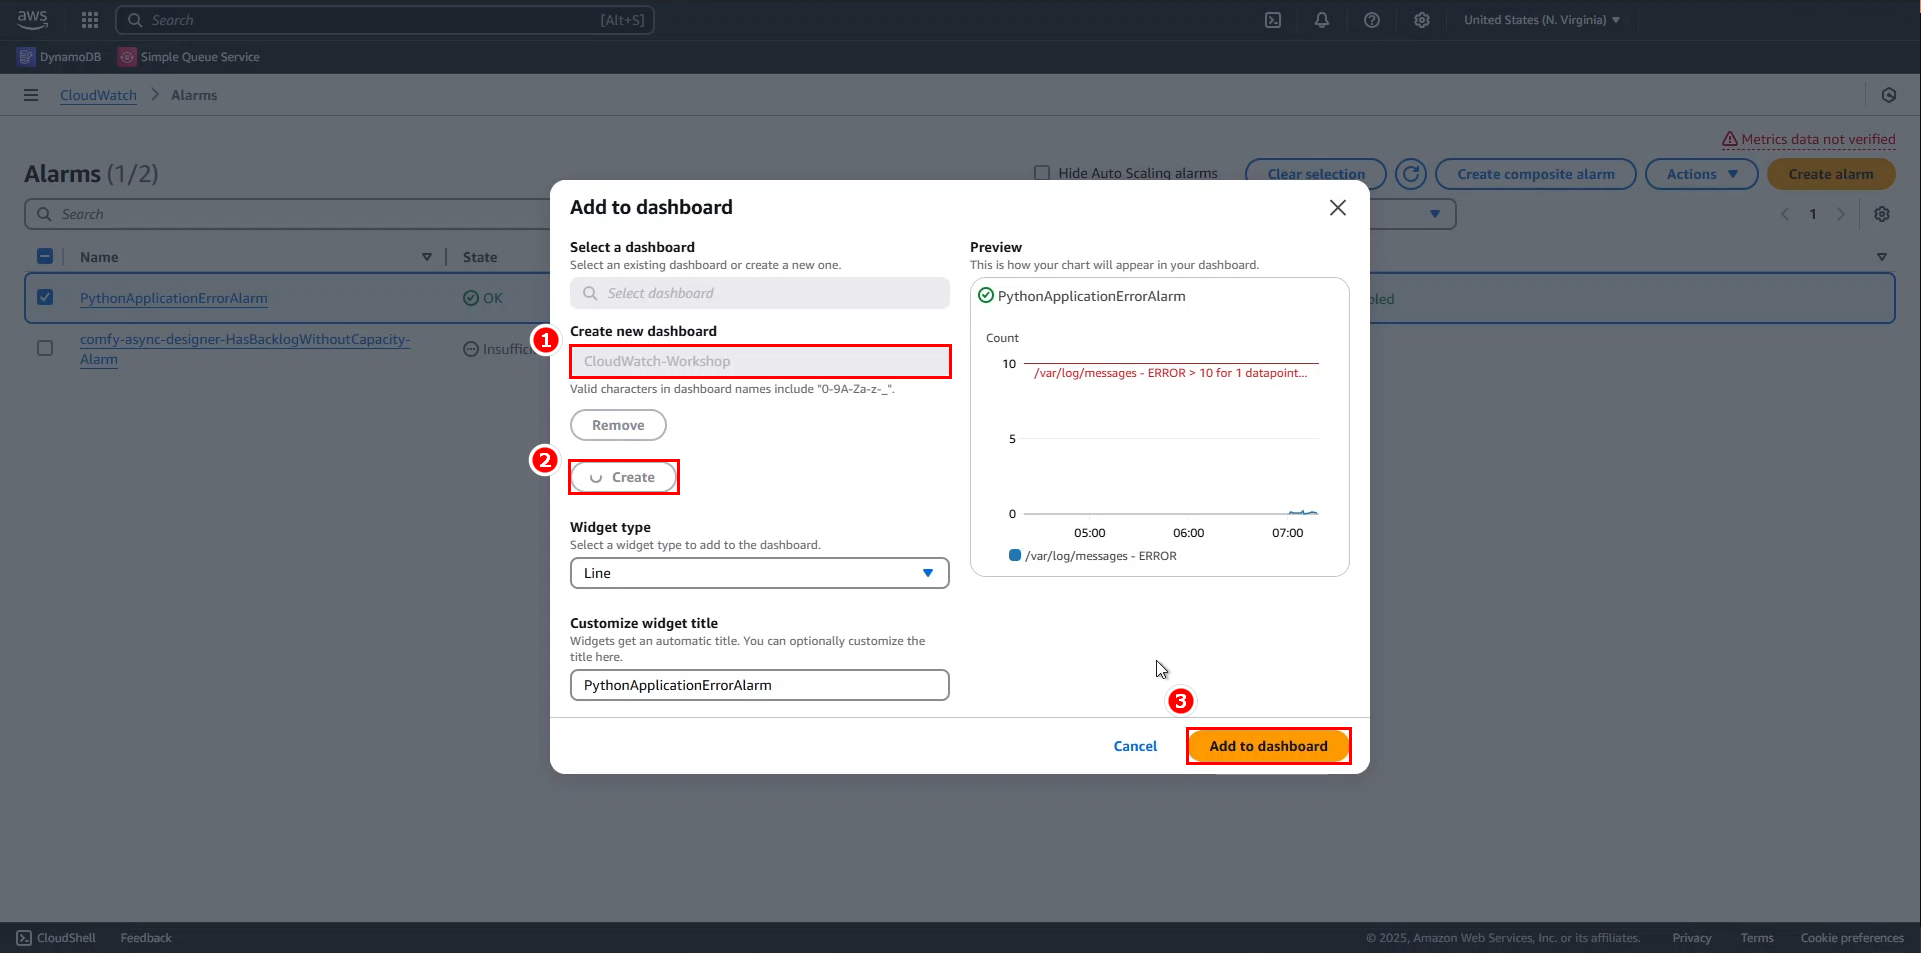
Configure your new dashboard:
- Enter dashboard name:
CloudWatch-Workshop - Click Create
- Click Add to dashboard
- Enter dashboard name:
💡 Pro Tip: Dashboards support cross-region monitoring, allowing you to track resources deployed across your global AWS infrastructure from a single view.
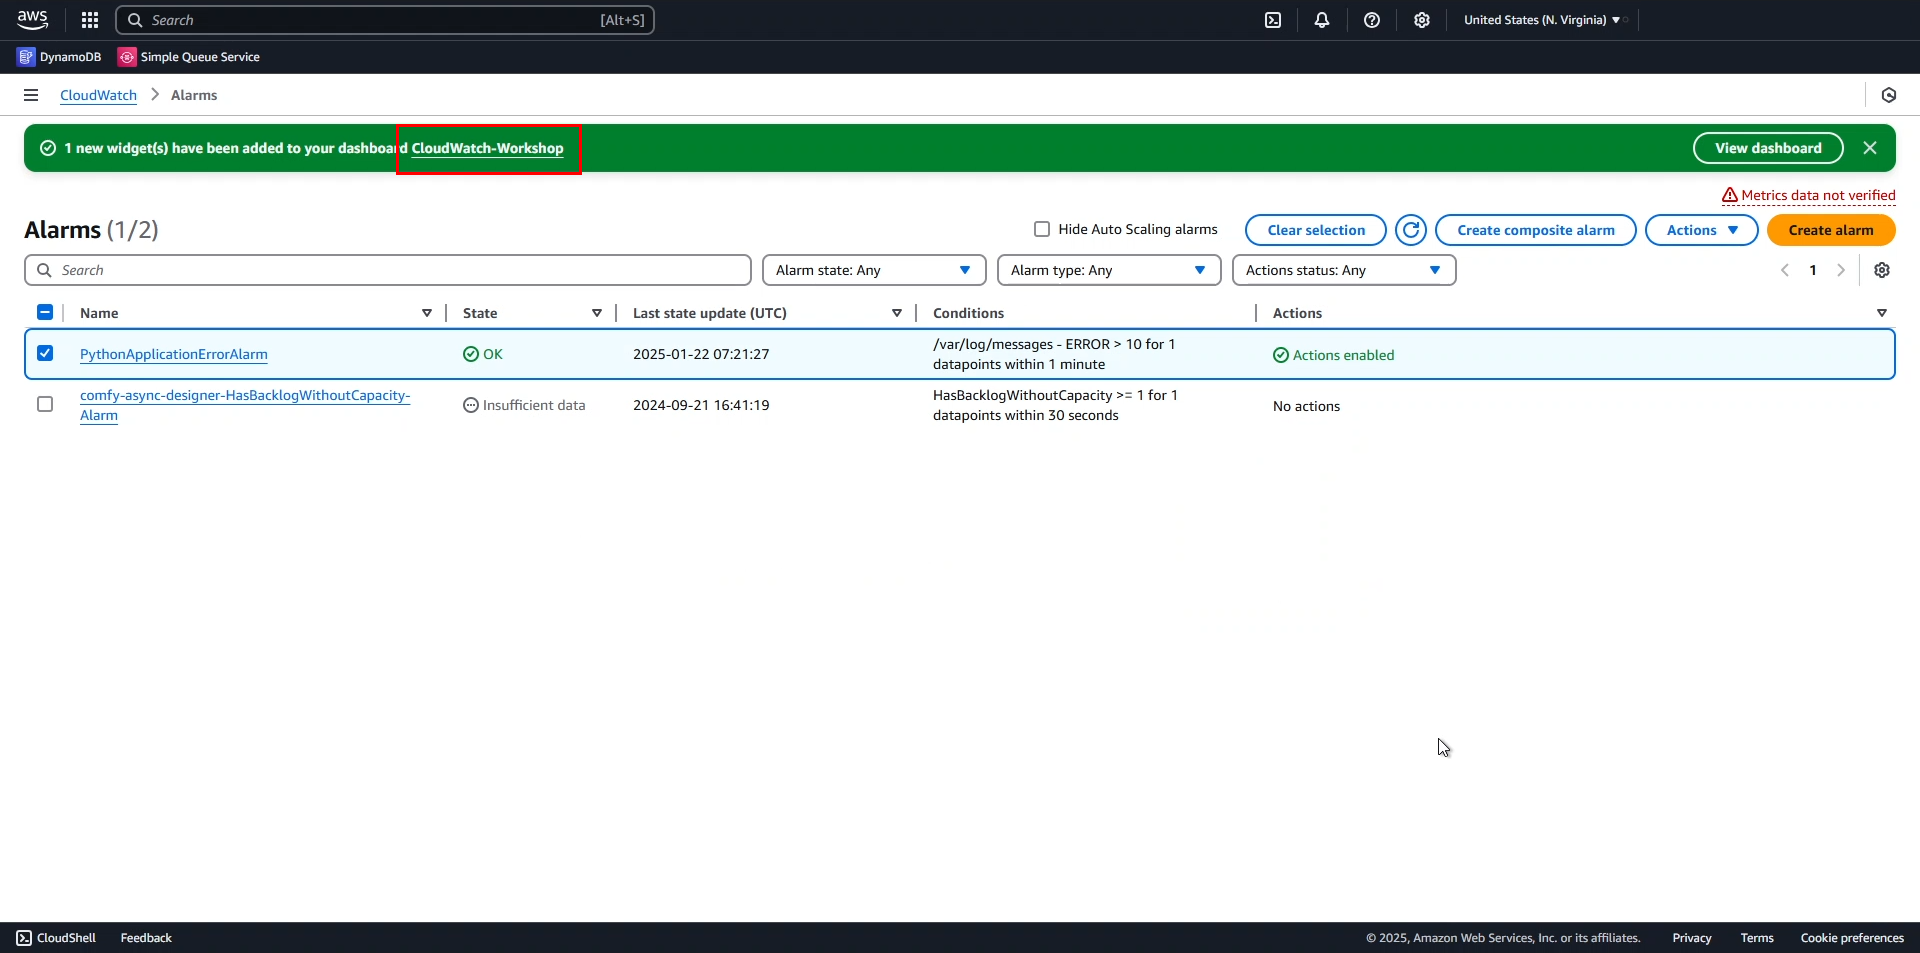
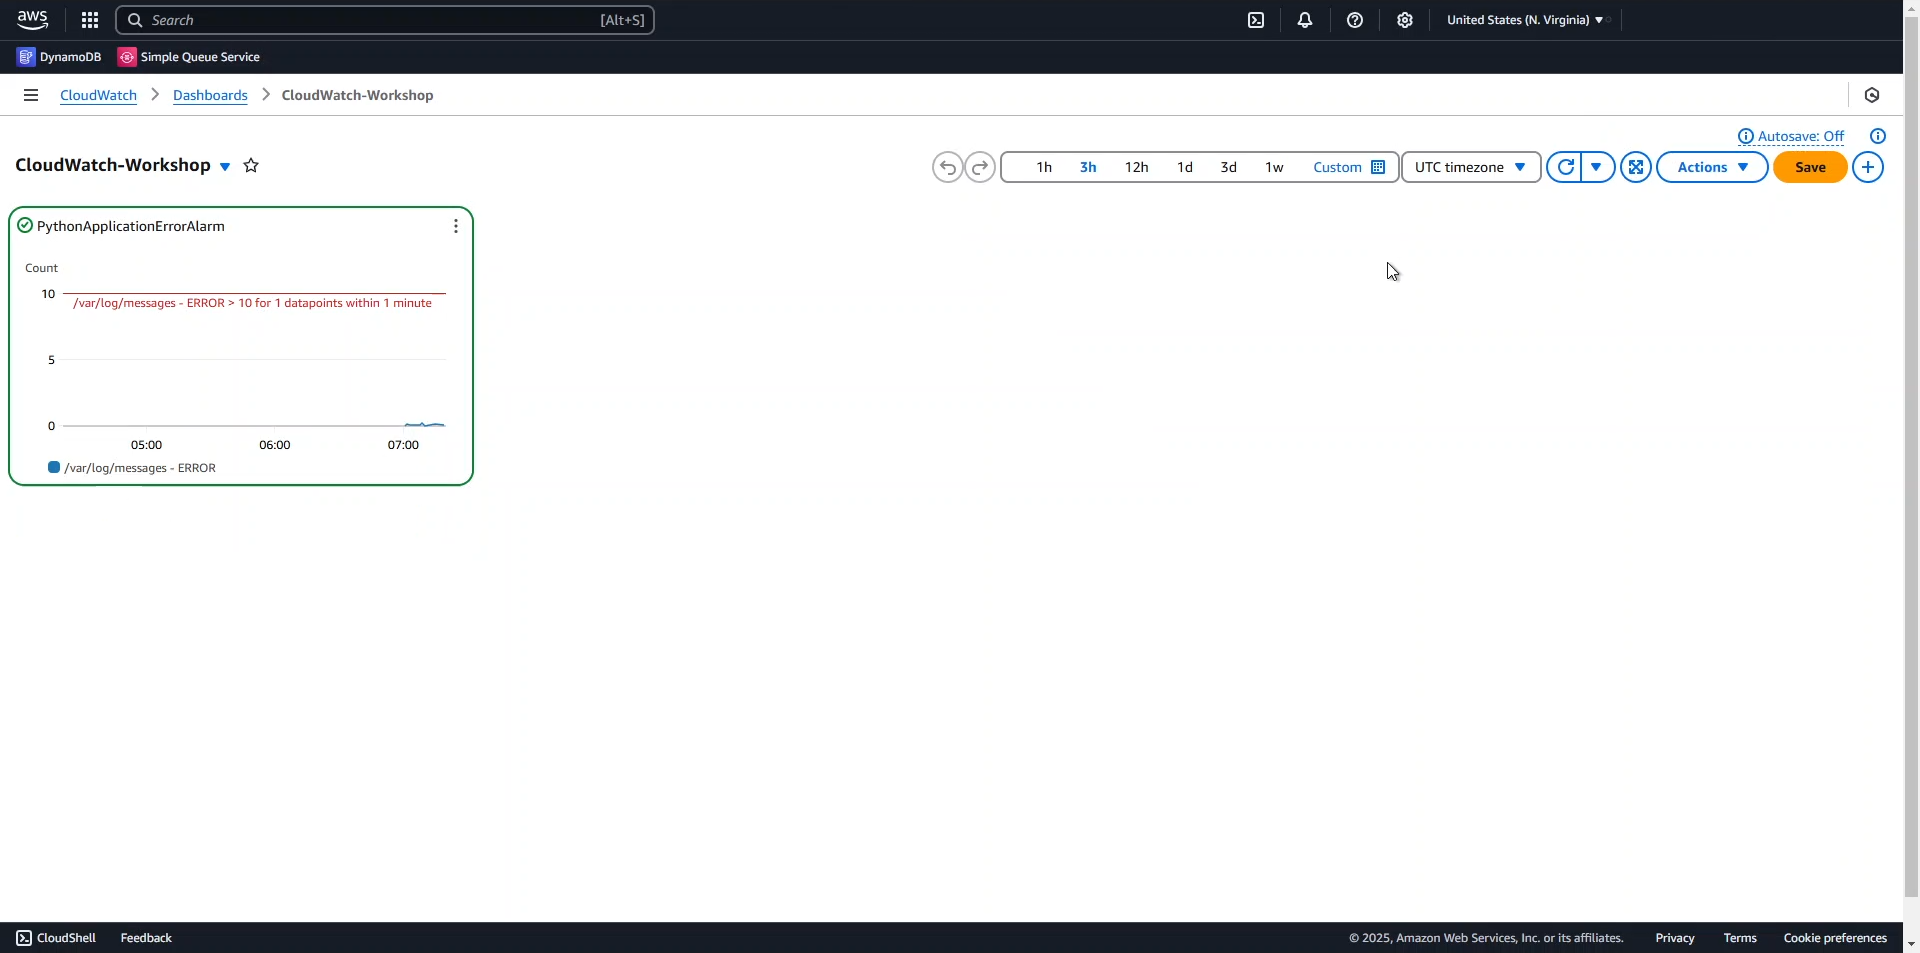
Your completed dashboard should now display the alarm widget:
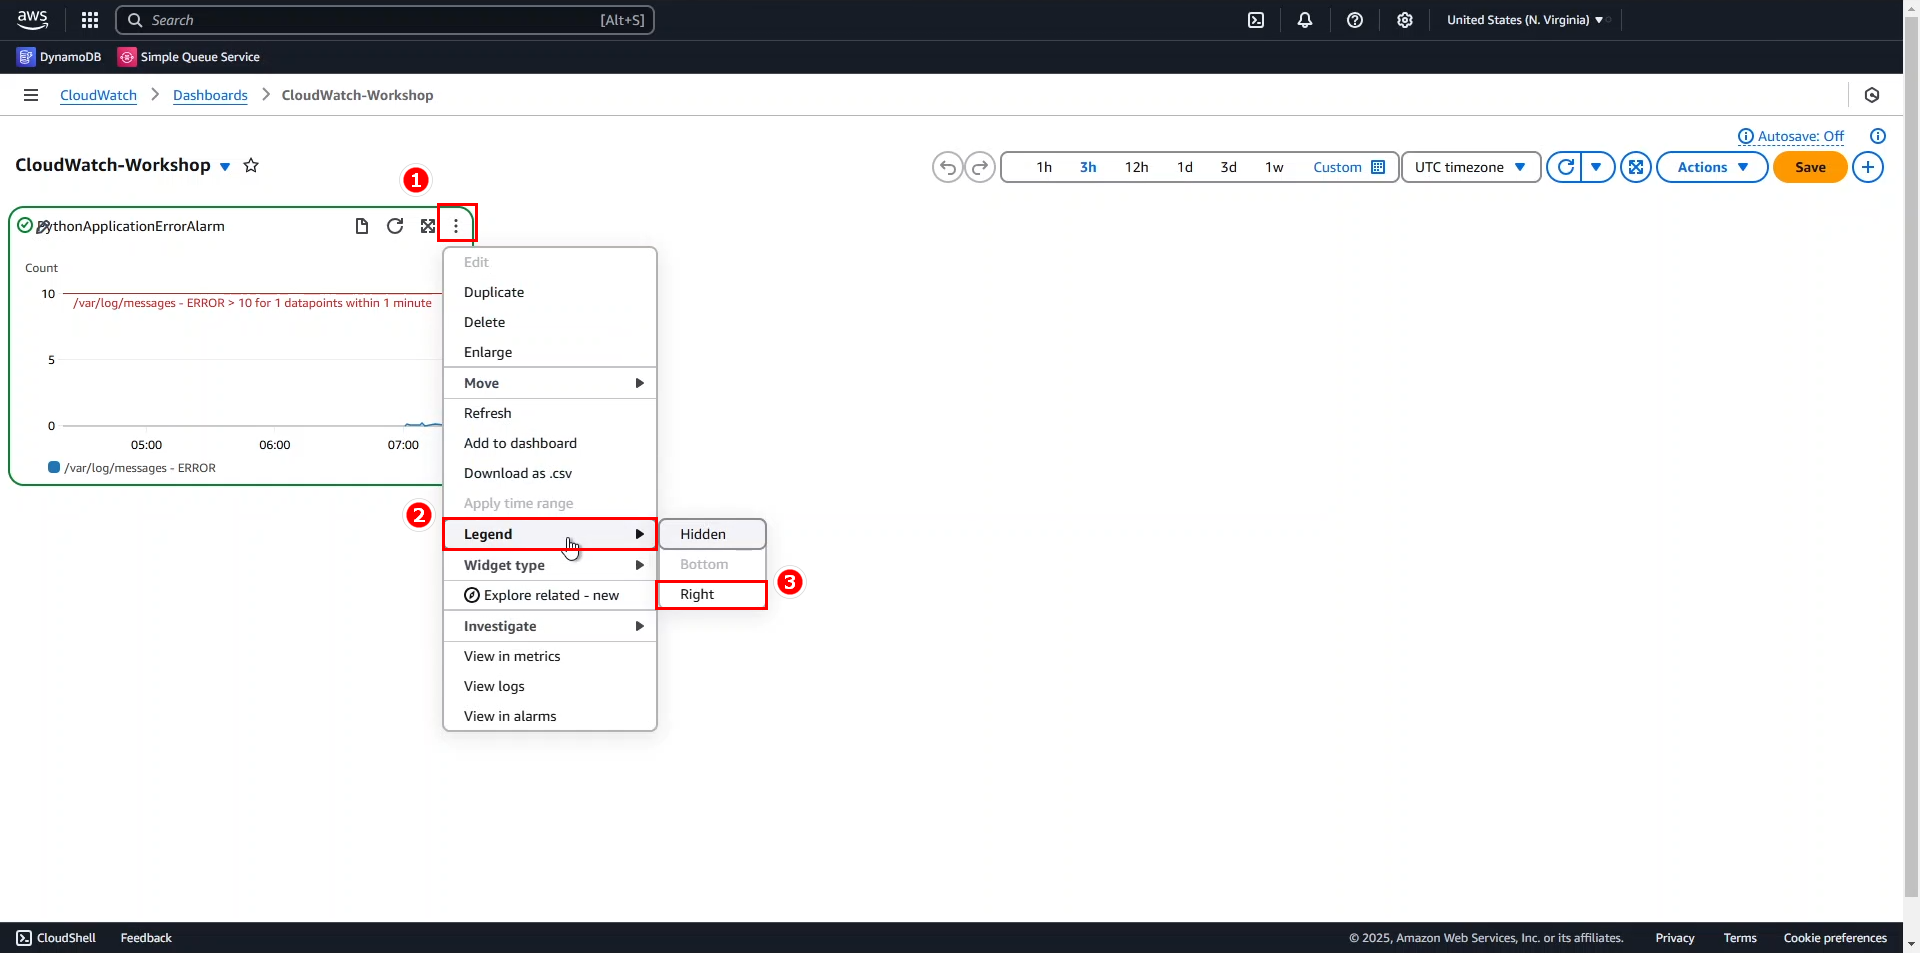
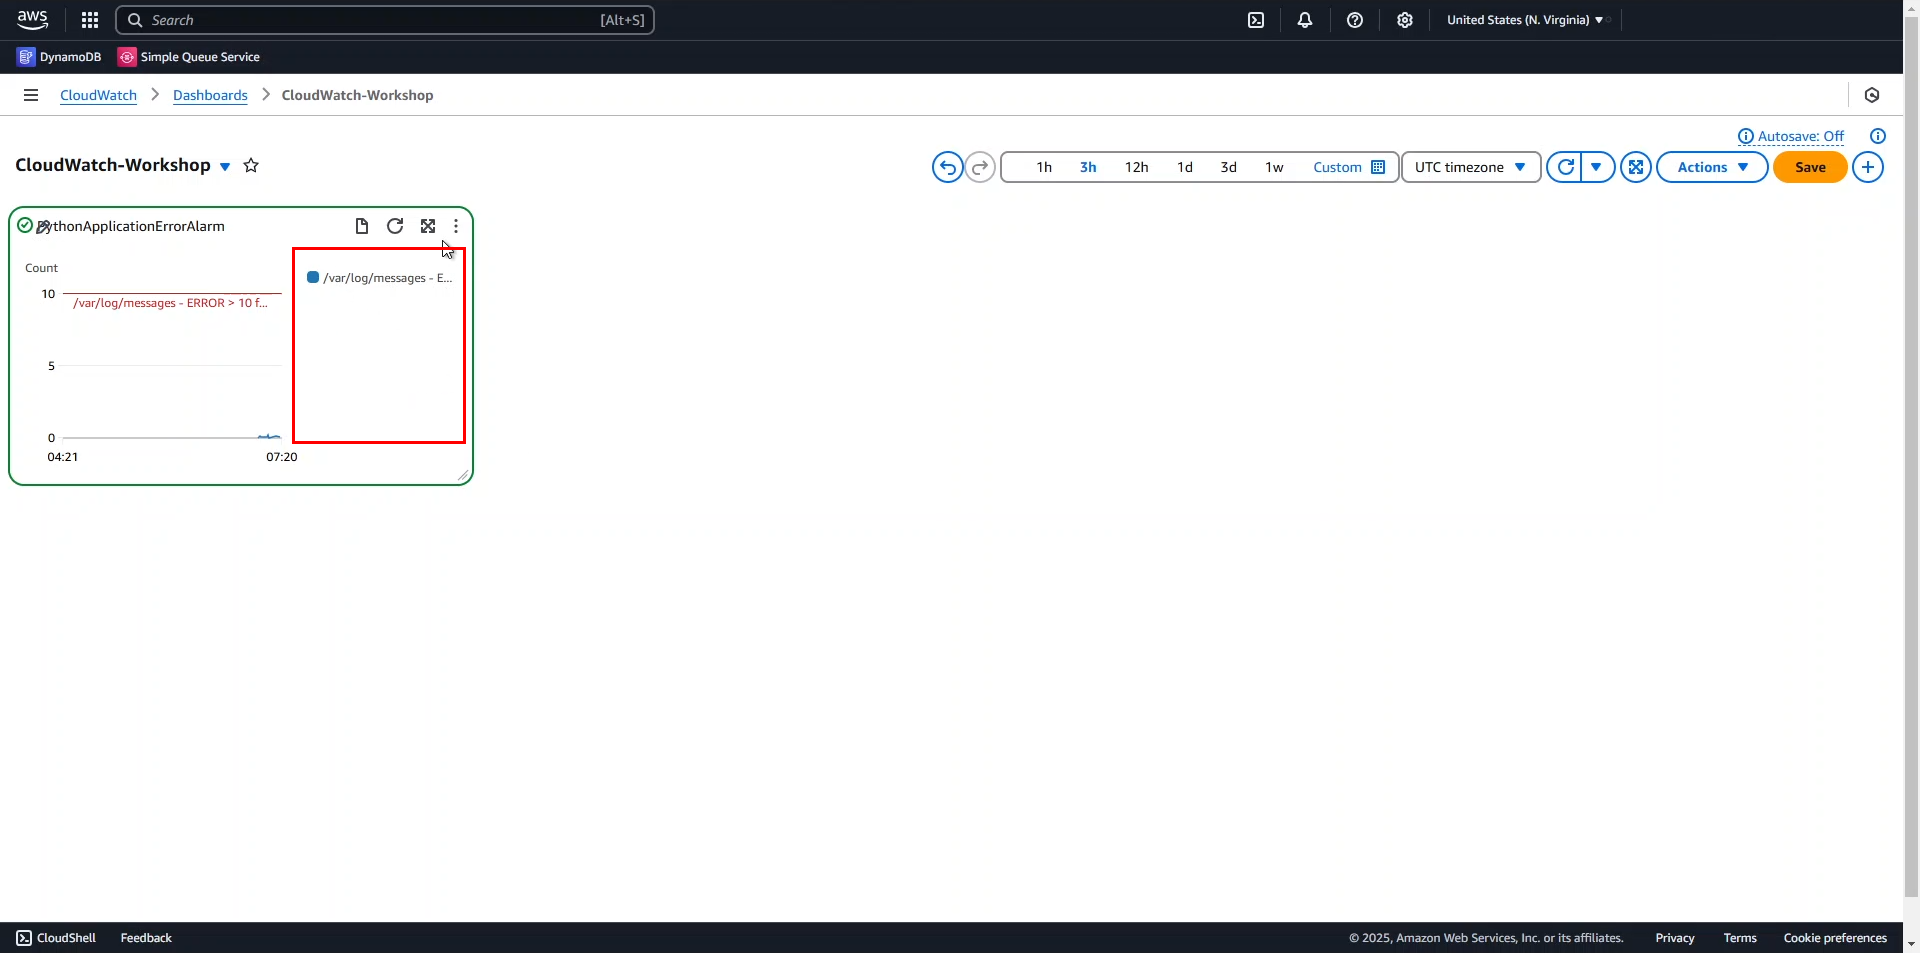
ℹ️ Information: Dashboard widgets are highly customizable. You can:
- Resize and reposition widgets by dragging
- Edit widget properties to change visualization types
- Add text annotations for context
- Share dashboards with your team
🔒 Security Note: Consider using AWS Identity and Access Management (IAM) to control who can view or modify your dashboards, especially when they contain sensitive operational metrics.
Congratulations on completing this workshop! You’ve successfully implemented a comprehensive monitoring solution using Amazon CloudWatch’s powerful features for metrics, logs, alarms, and dashboards.