Viewing Metrics
Viewing CloudWatch Metrics
ℹ️ Information: In this section, you’ll learn how to navigate and visualize Amazon CloudWatch metrics to gain insights into your AWS resources’ performance and health.
Accessing CloudWatch Metrics
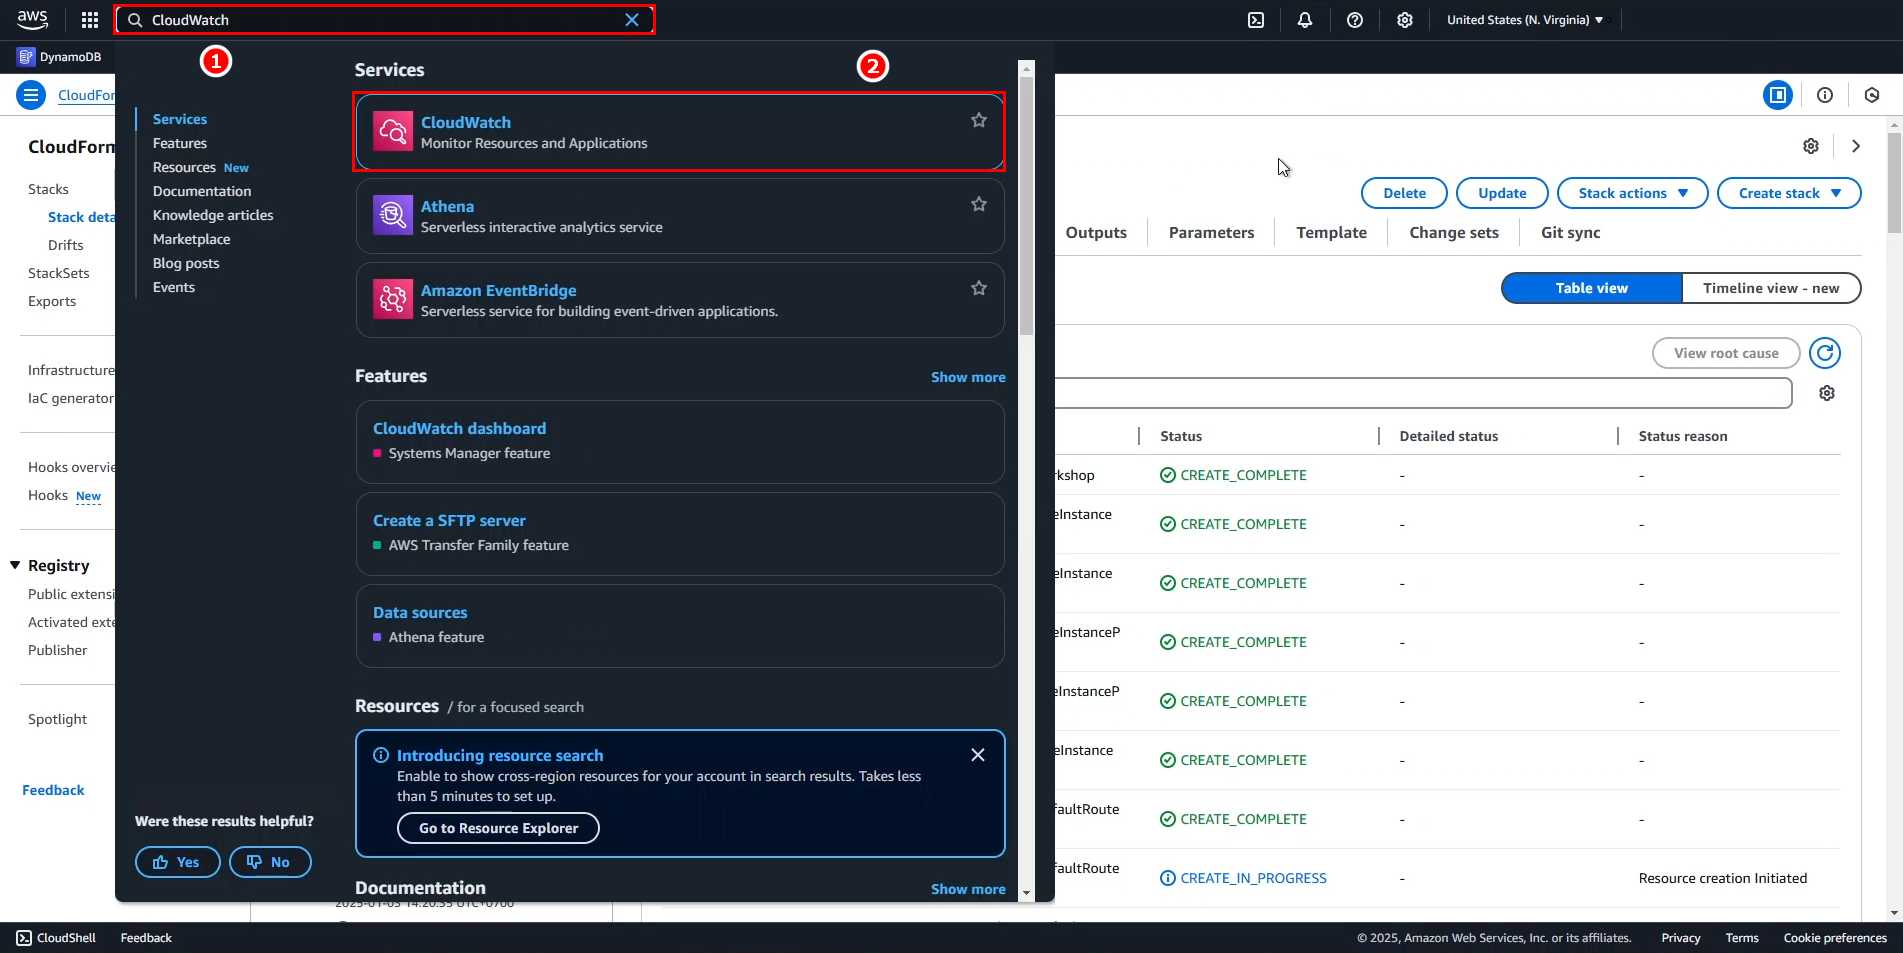
- Access the AWS Management Console:
- In the search bar, type CloudWatch.
- Select CloudWatch from the services list.
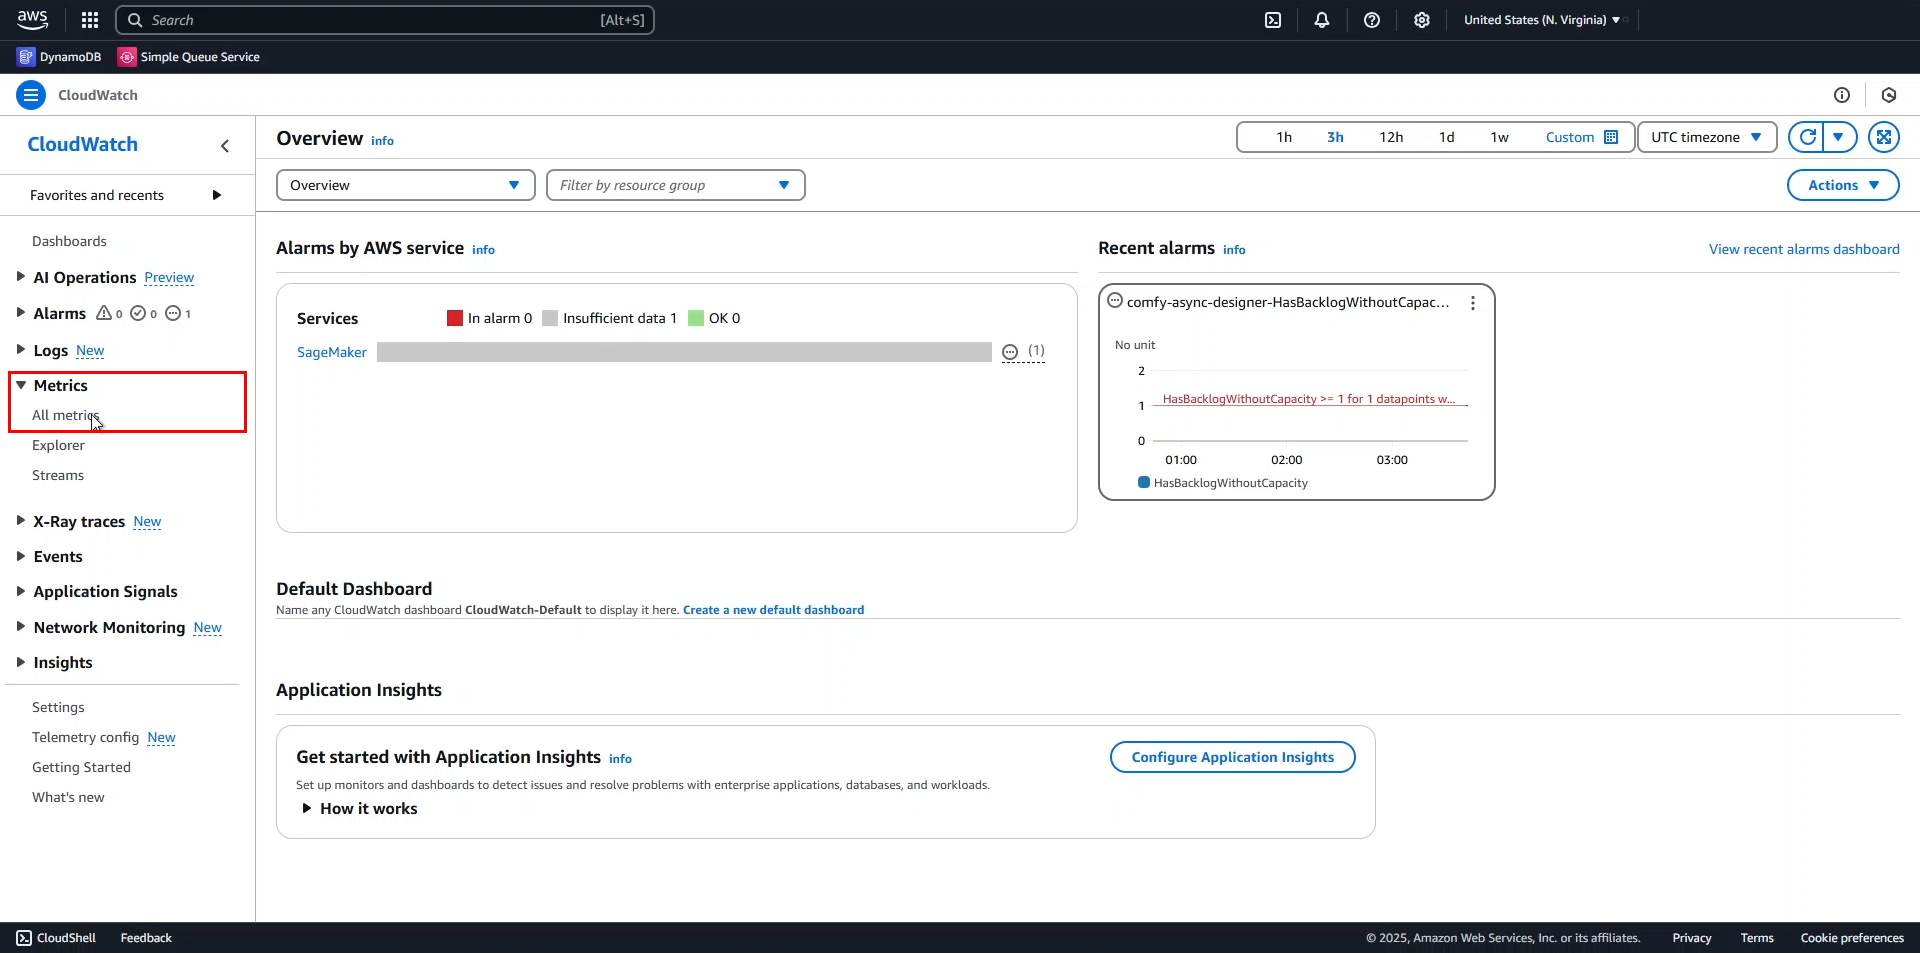
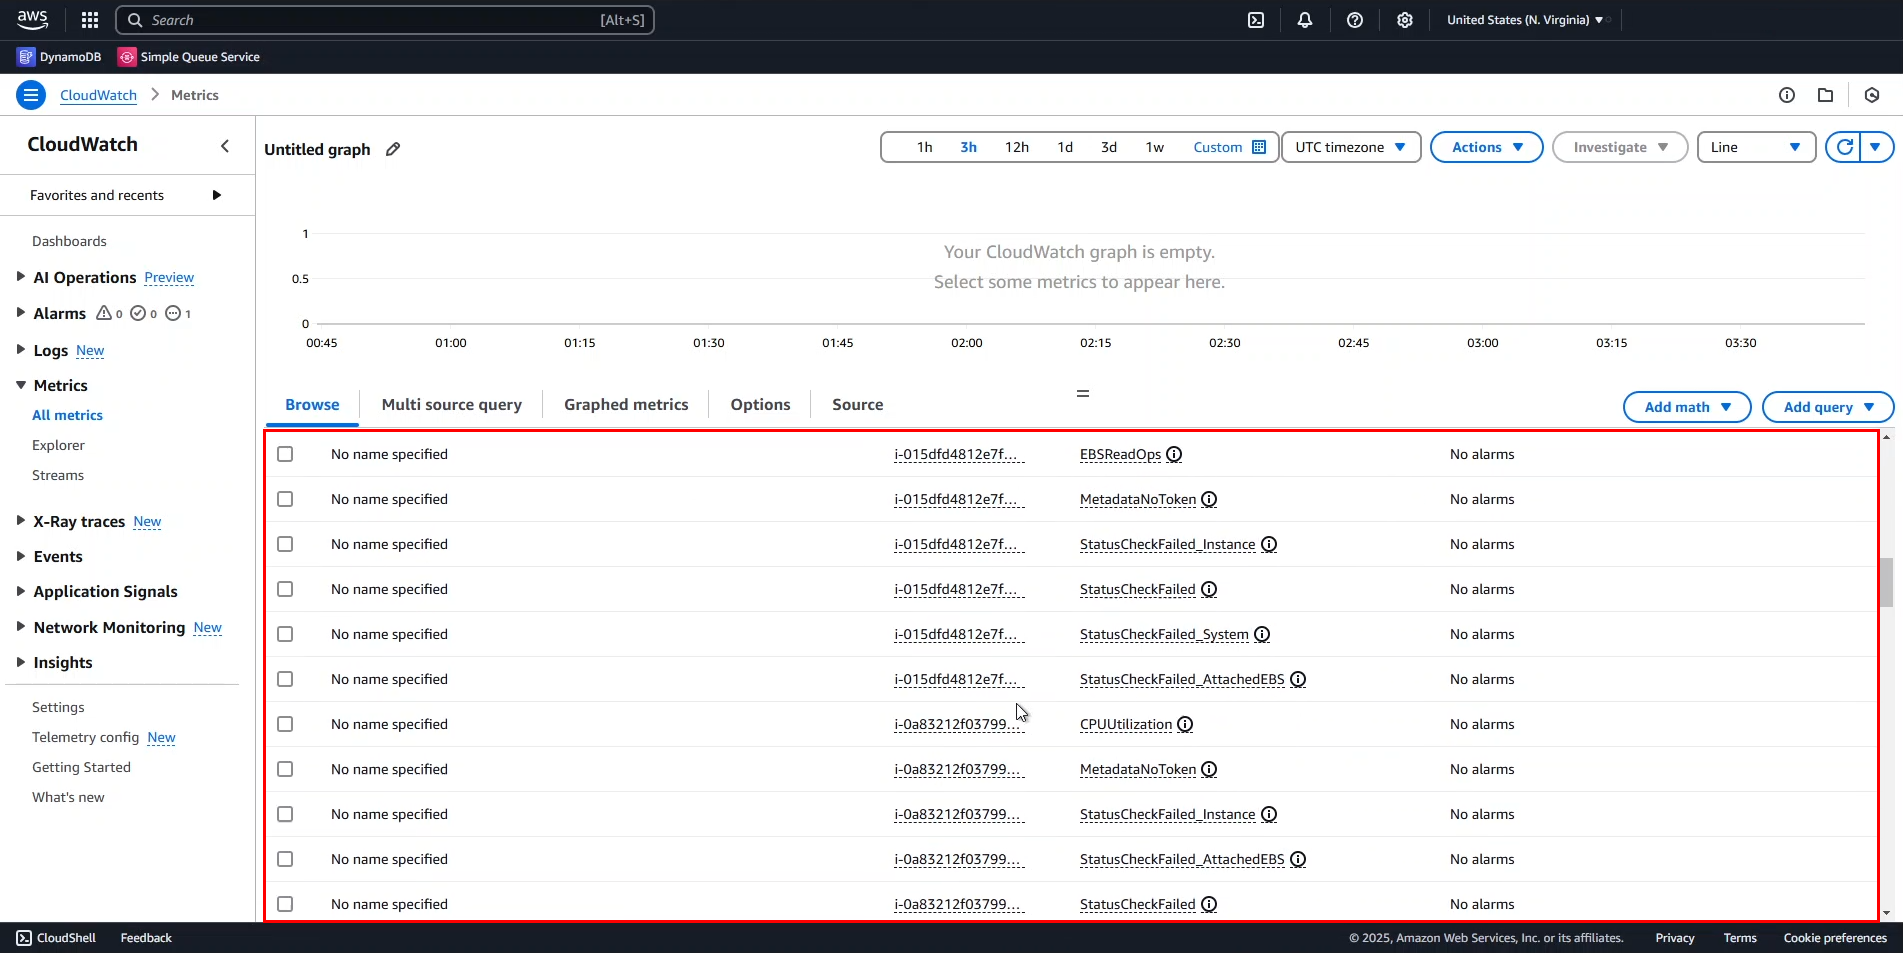
- In the CloudWatch console:
- Expand the Metrics section in the left navigation pane.
- Select All metrics.
Finding EC2 Instance Metrics
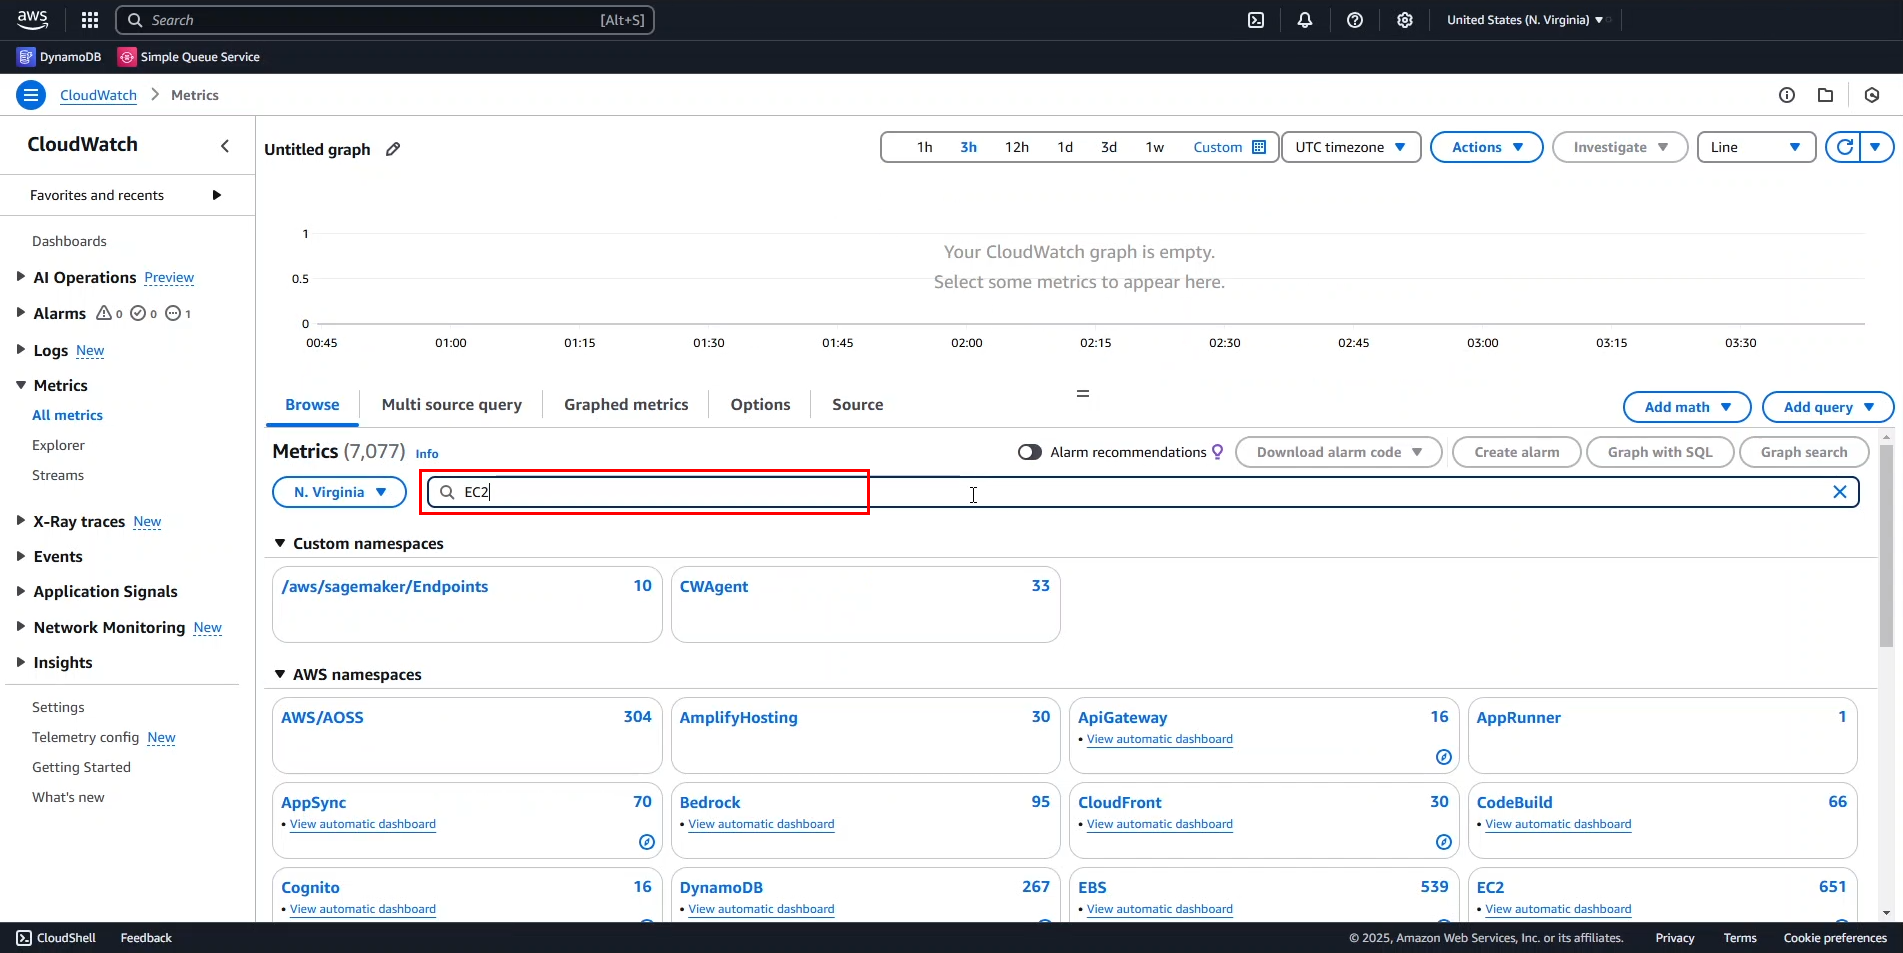
- In the metrics dashboard:
- Enter
EC2in the search bar to filter metrics by service.
- Enter
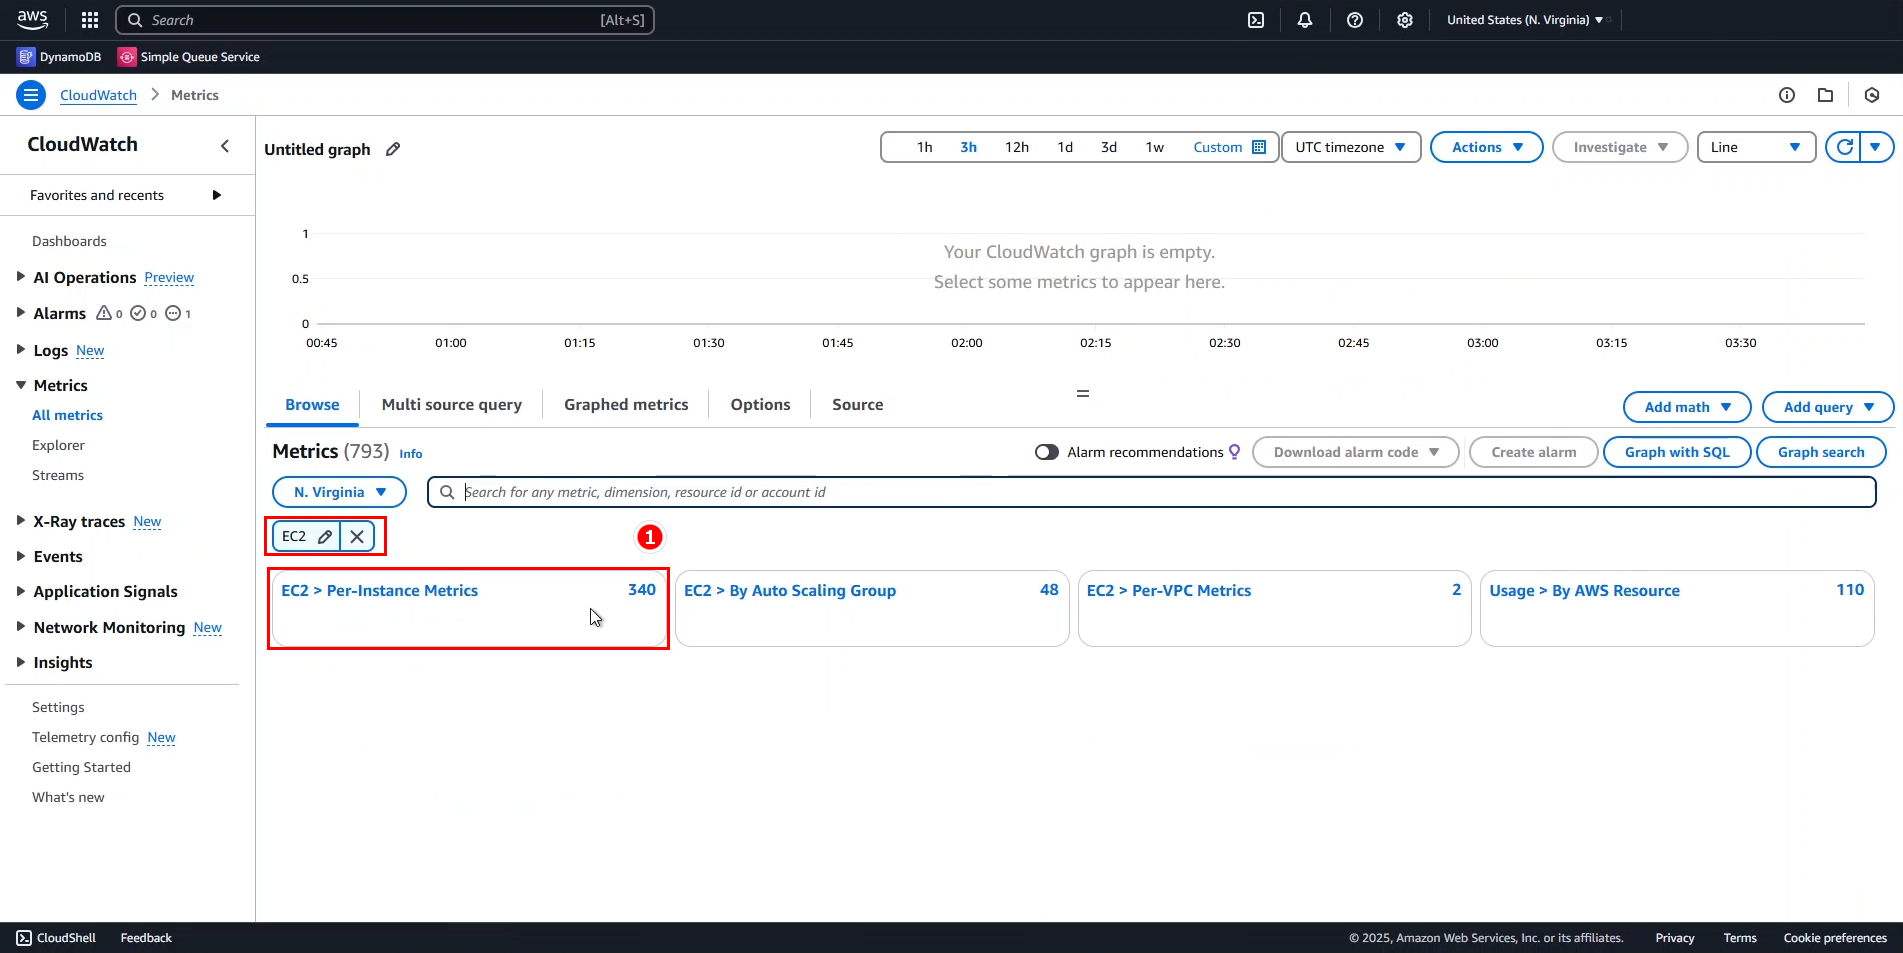
- From the search results:
- Select EC2 > Per-Instance Metrics to view metrics for individual EC2 instances.
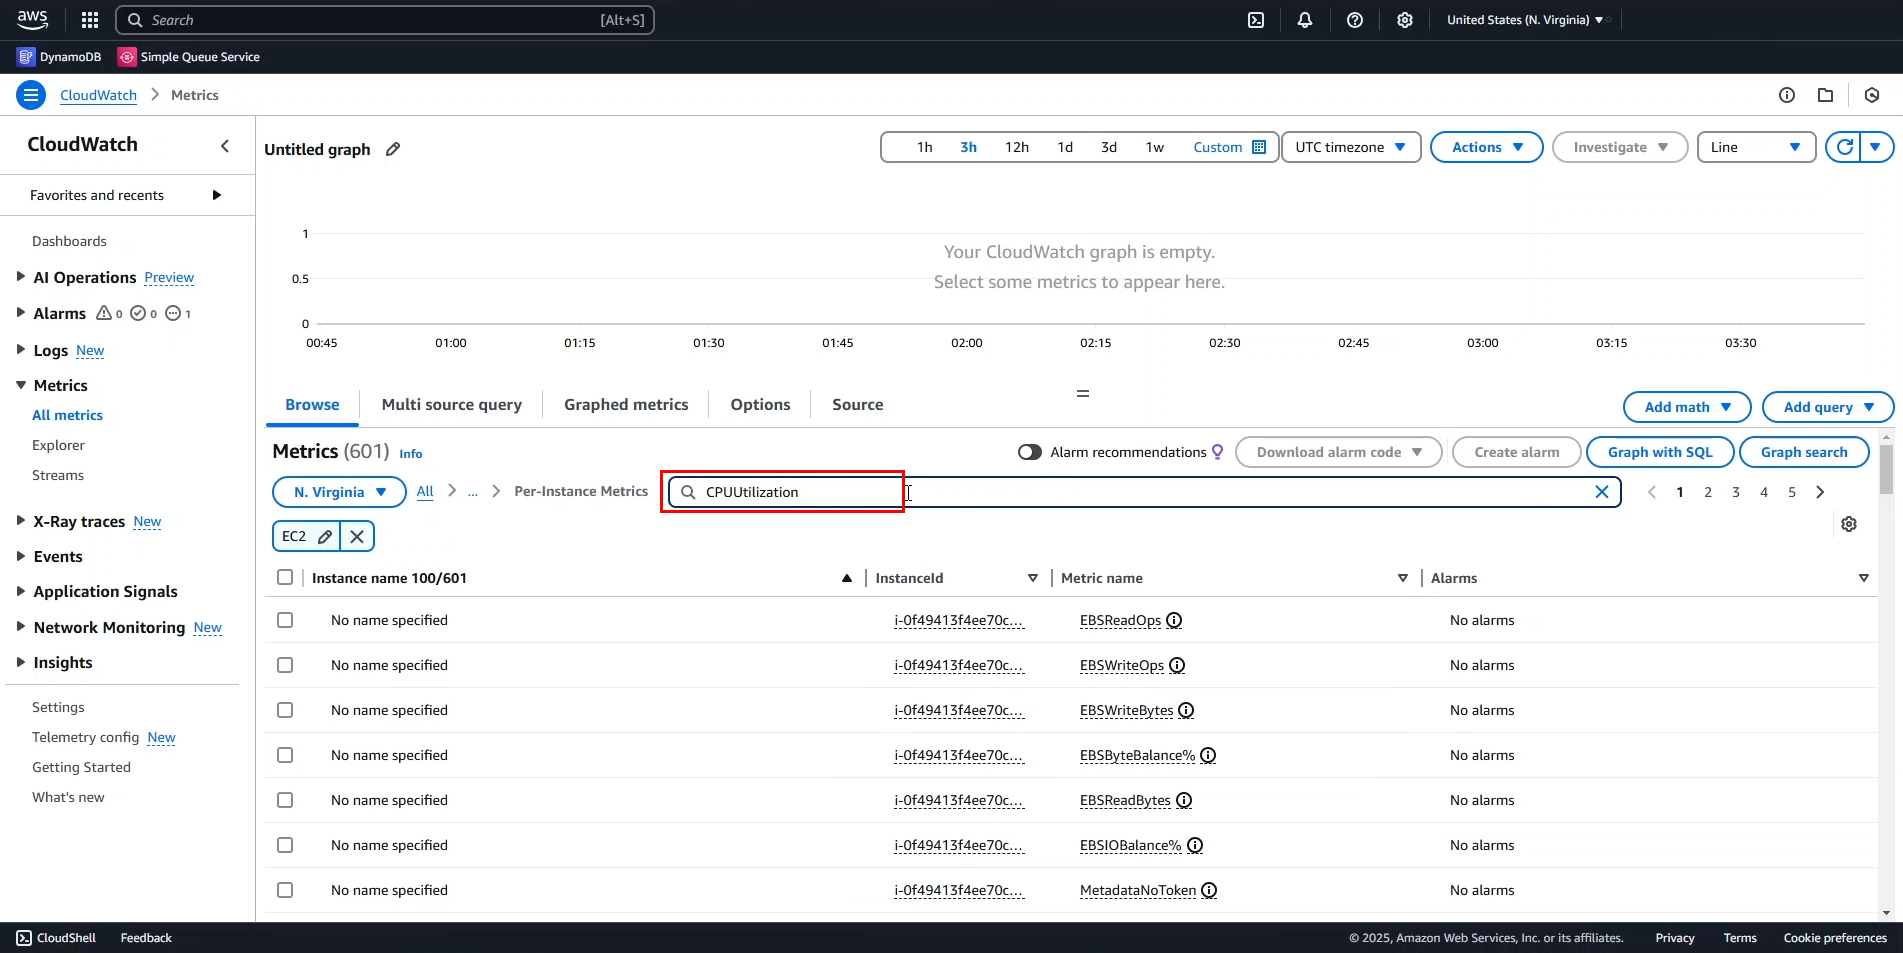
Analyzing CPU Utilization
- Filter for specific metrics:
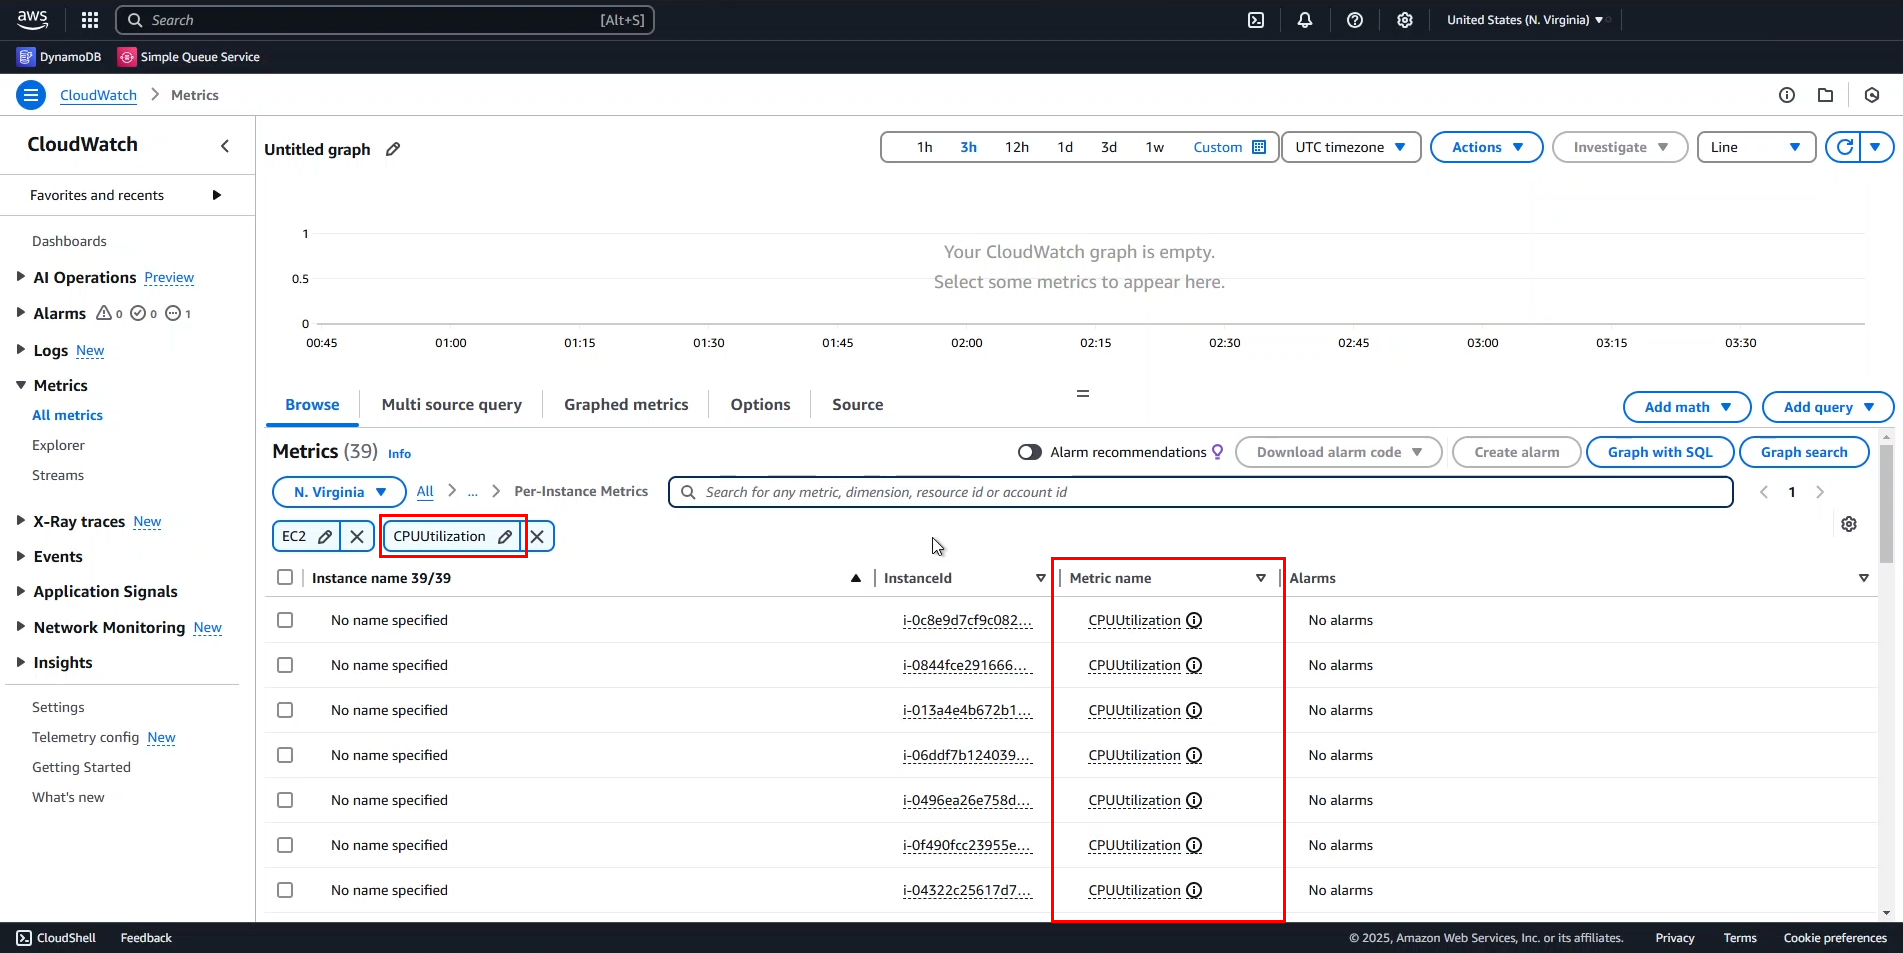
- In the search bar, type
CPUUtilizationand press Enter. - By default, CloudWatch searches by Metric name.
- In the search bar, type
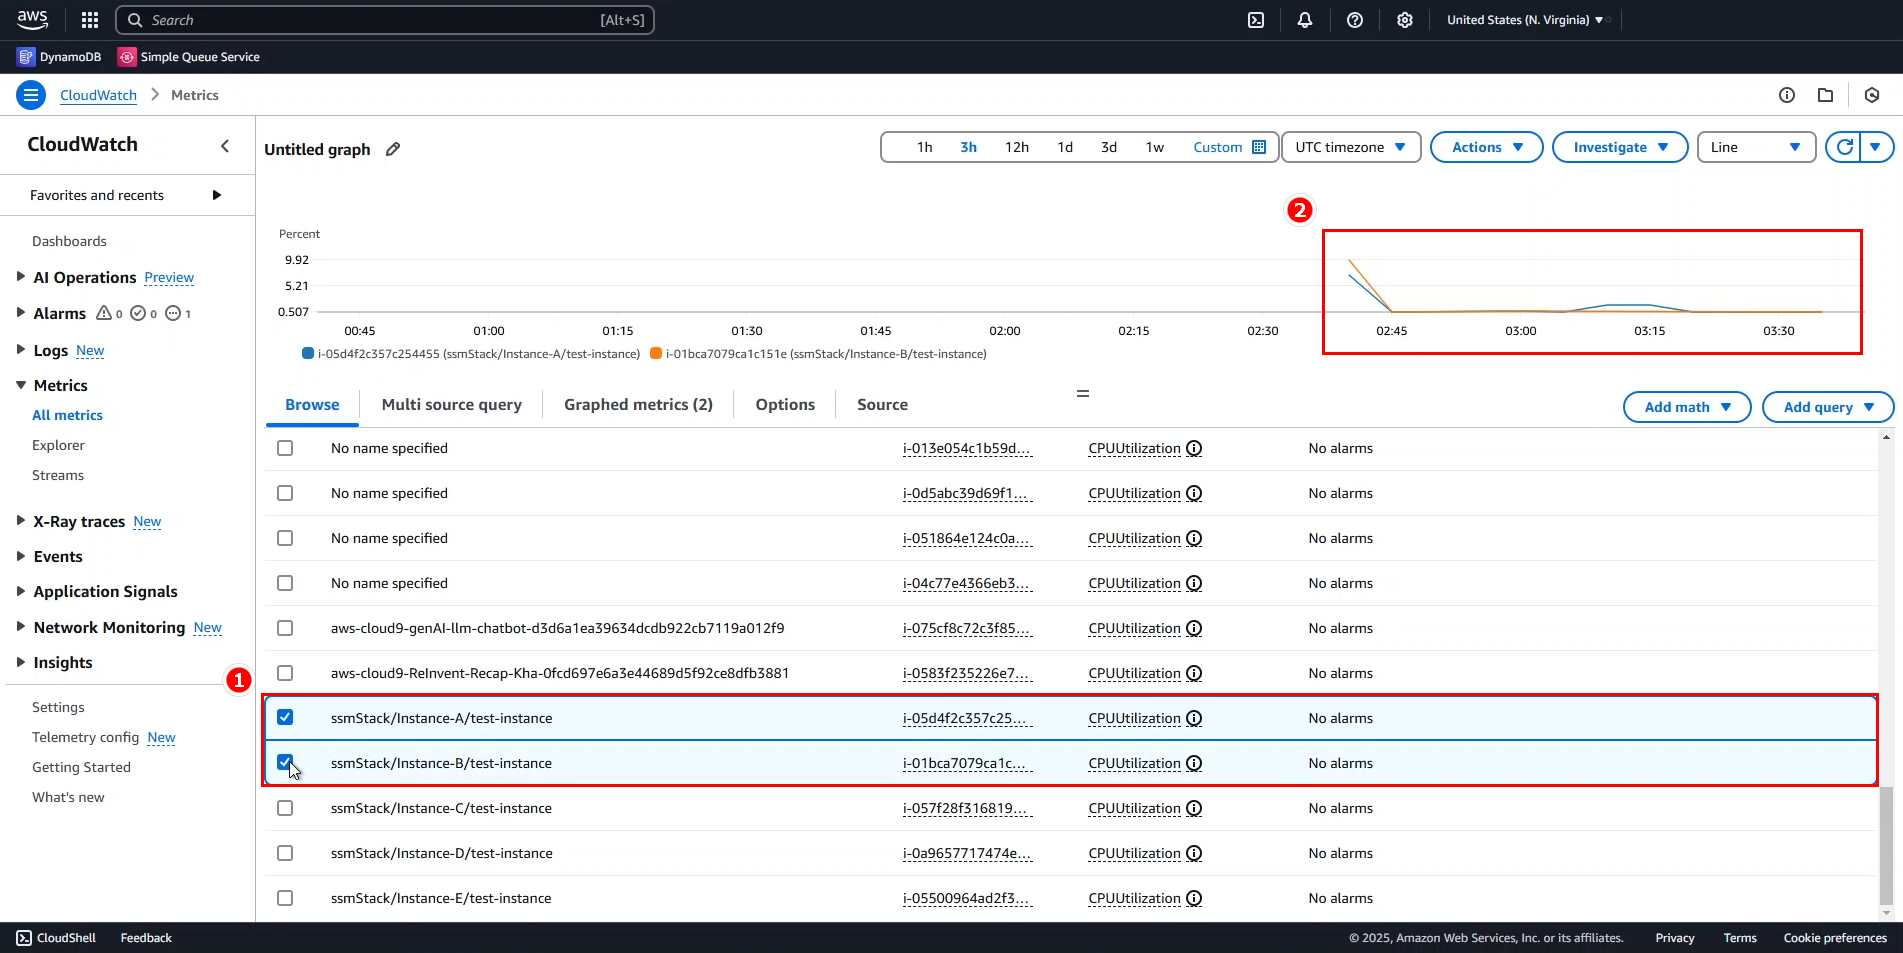
- Compare instance performance:
- Select two of the five instances created by the CloudFormation stack.
- Scroll down to view the graphed data.
💡 Pro Tip: When comparing multiple instances, look for patterns that might indicate system-wide events versus instance-specific issues.
- Analyze the graph data:
- Both instances initiated operations around 2:40 AM, showing peak activity at this time.
- By 3:30 AM, both instances appear to have completed their workloads.
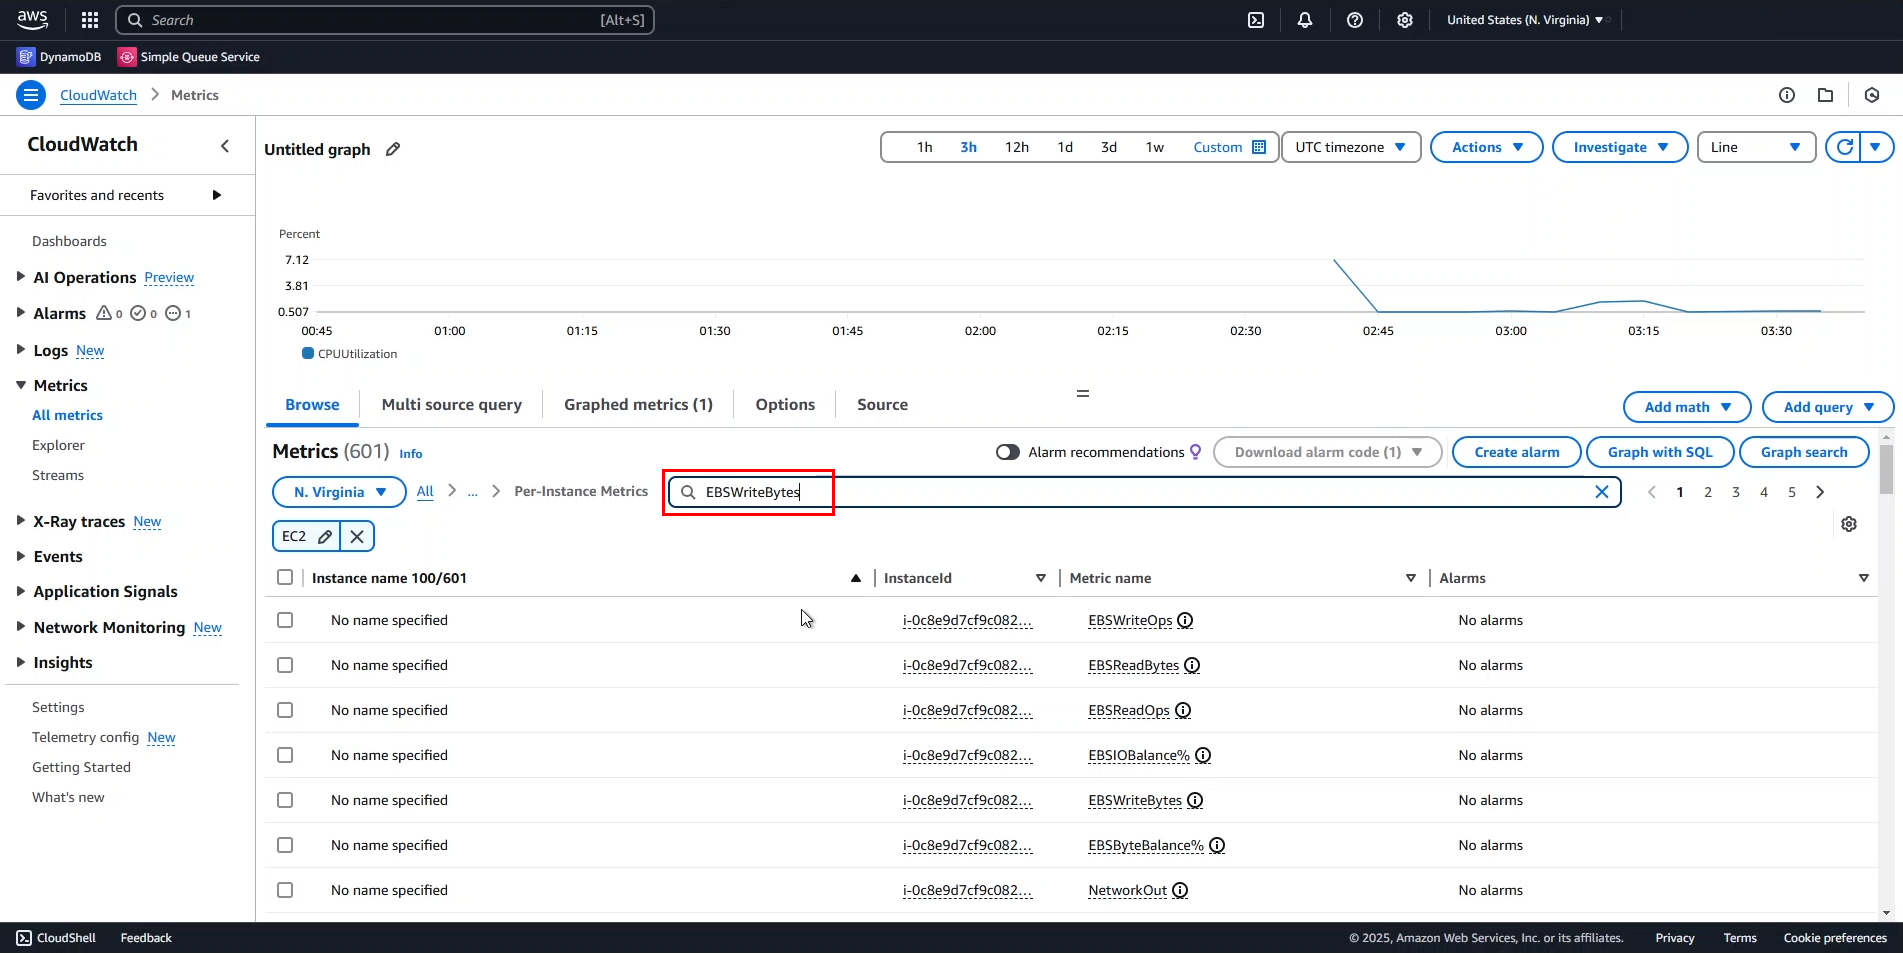
Examining Multiple Metrics
- Focus on a single instance:
- Deselect the line for Instance B.
- Clear the CPUUtilization filter.
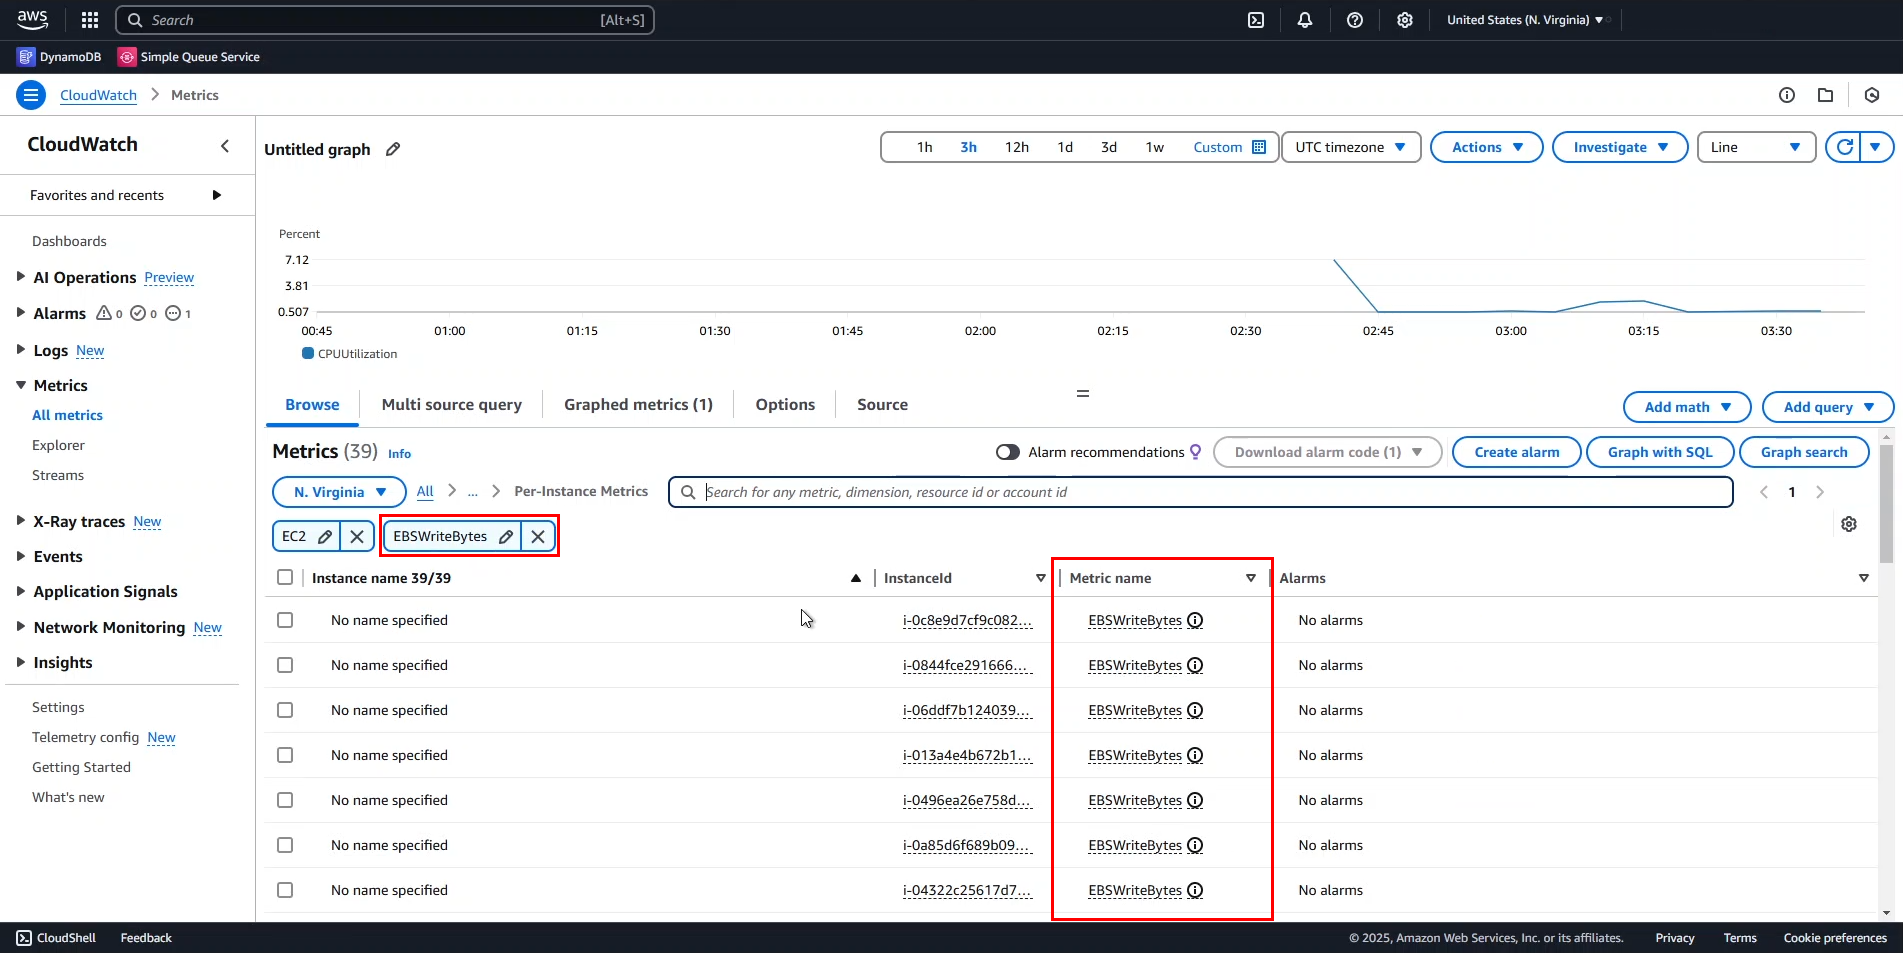
- Search for
EBSWriteBytesto examine storage I/O.
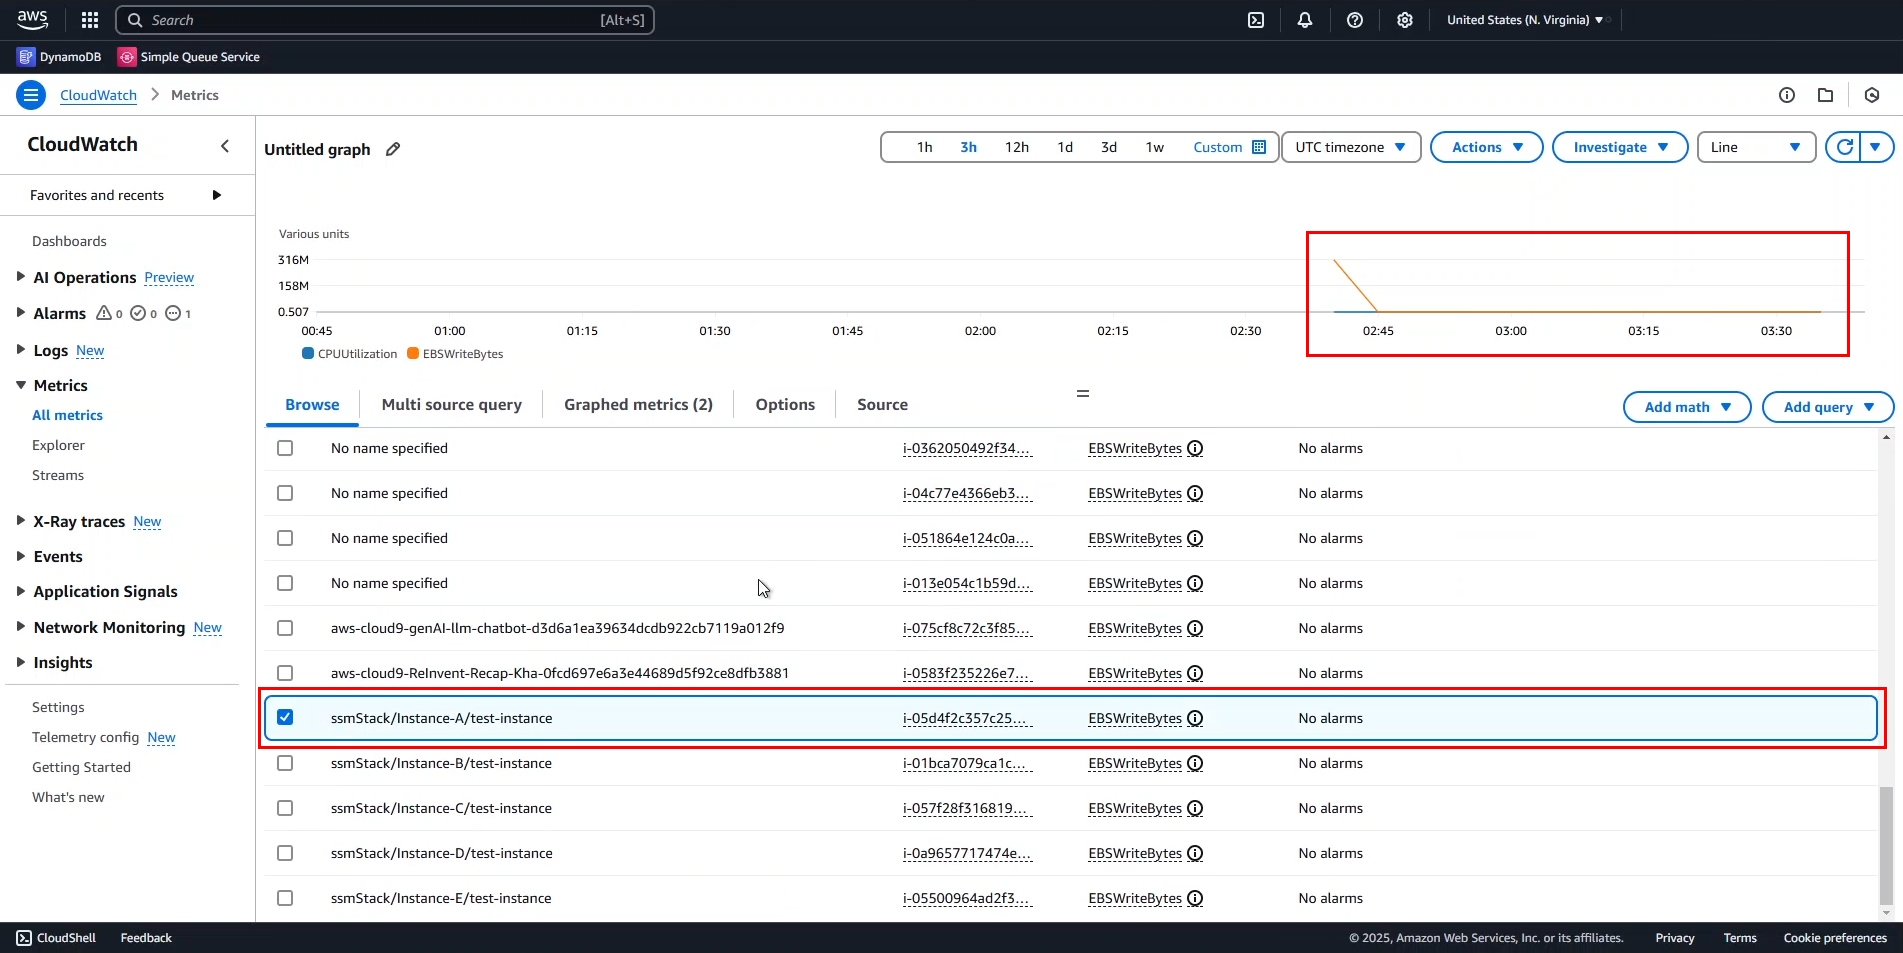
- Select Instance A and analyze the correlation:
- Initially, high volume of EBS read/write operations indicates data processing.
- CPUUtilization and EBSWriteBytes follow similar patterns with some divergence.
- This suggests the application primarily interacts with EBS during startup before transitioning to other operations.
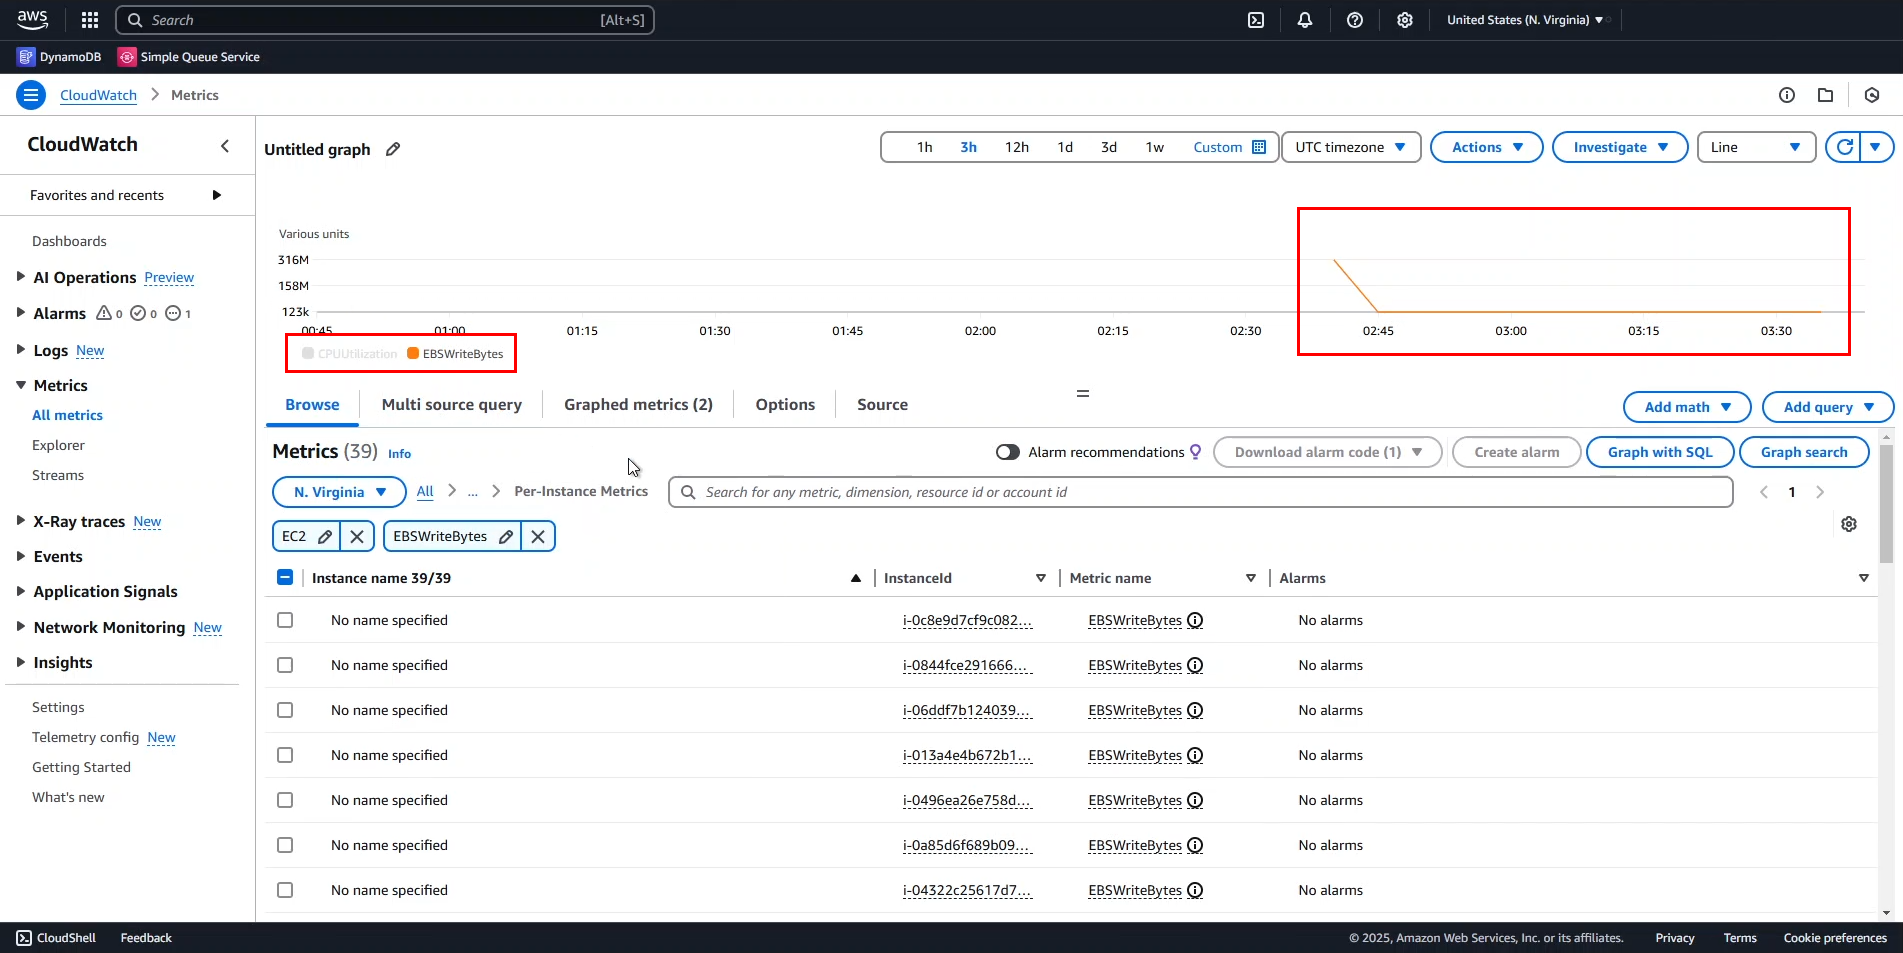
- For clearer analysis:
- You can hide individual metrics by toggling their visibility.
ℹ️ Information: In the next section, we’ll explore more advanced visualization techniques for better metric analysis.
Enhancing Chart Visualization
When multiple metrics with different units are displayed on the same chart, interpretation can be challenging. Let’s improve visualization with CloudWatch’s advanced charting features.
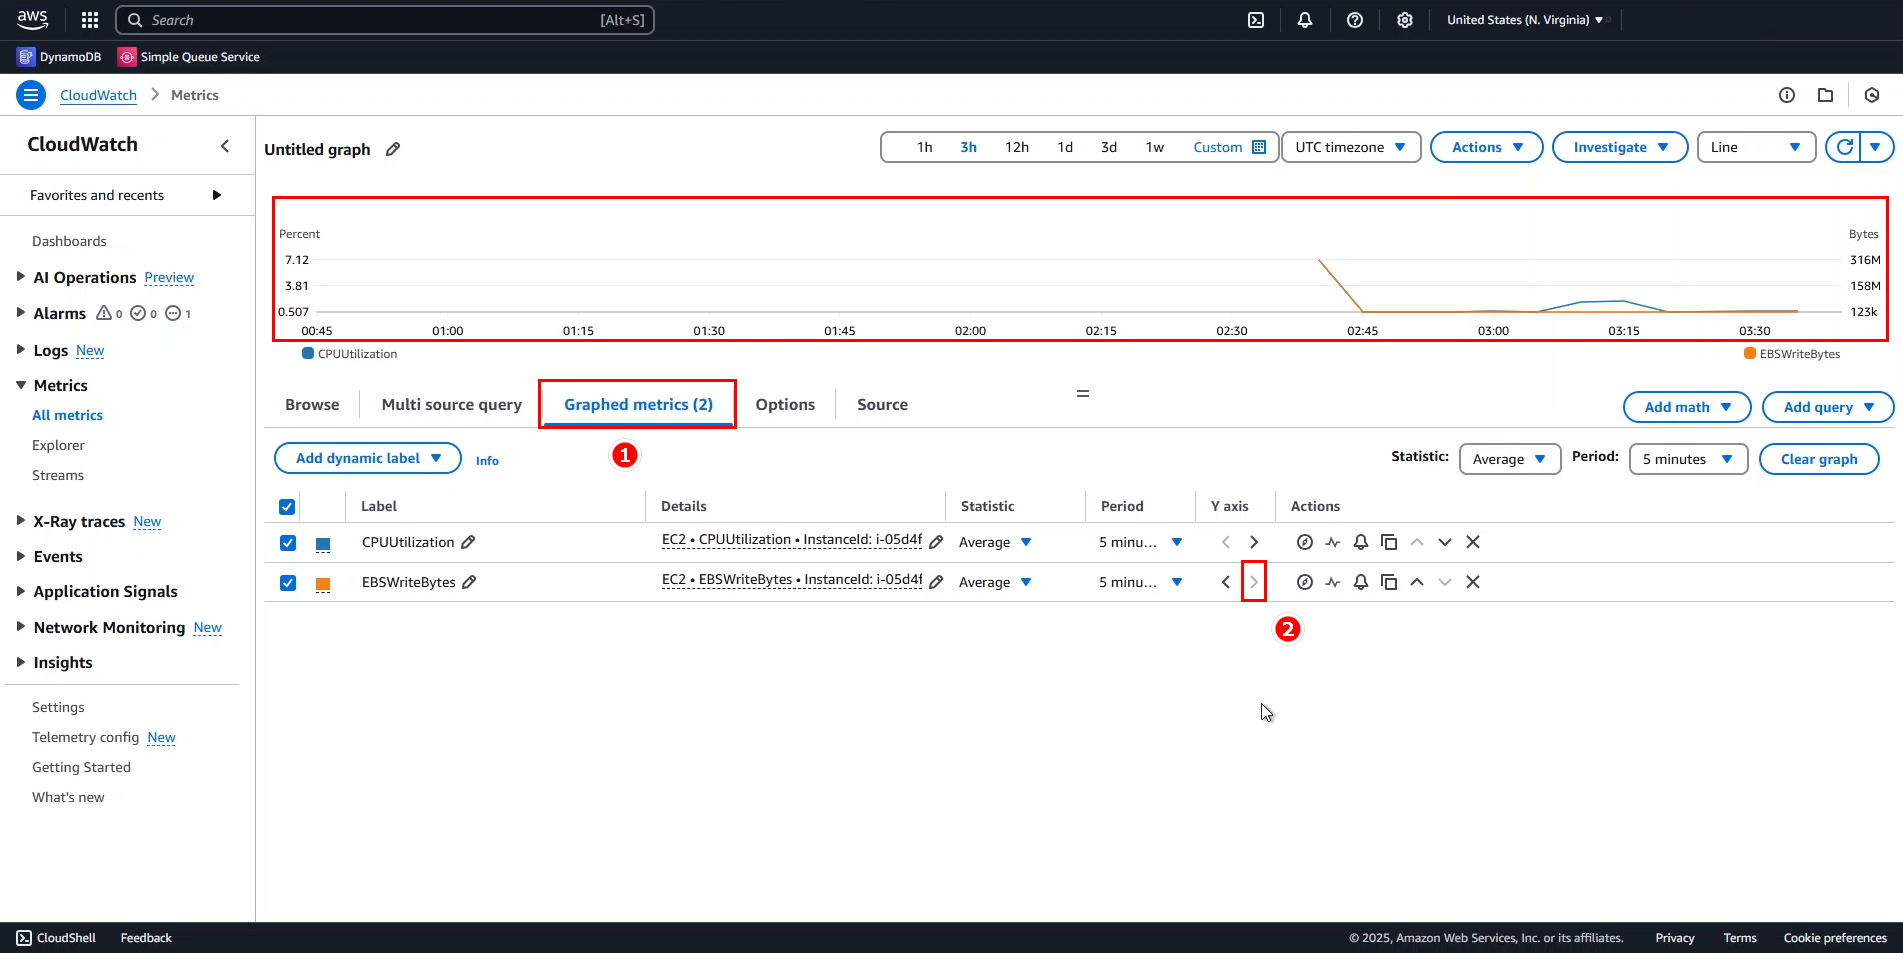
- Separate Y-axis for different metrics:
- Navigate to the Graphed metrics tab.
- For EBSWriteBytes, click the Y-axis column dropdown and select Right Y-axis.
- The chart now displays each metric on its appropriate scale.
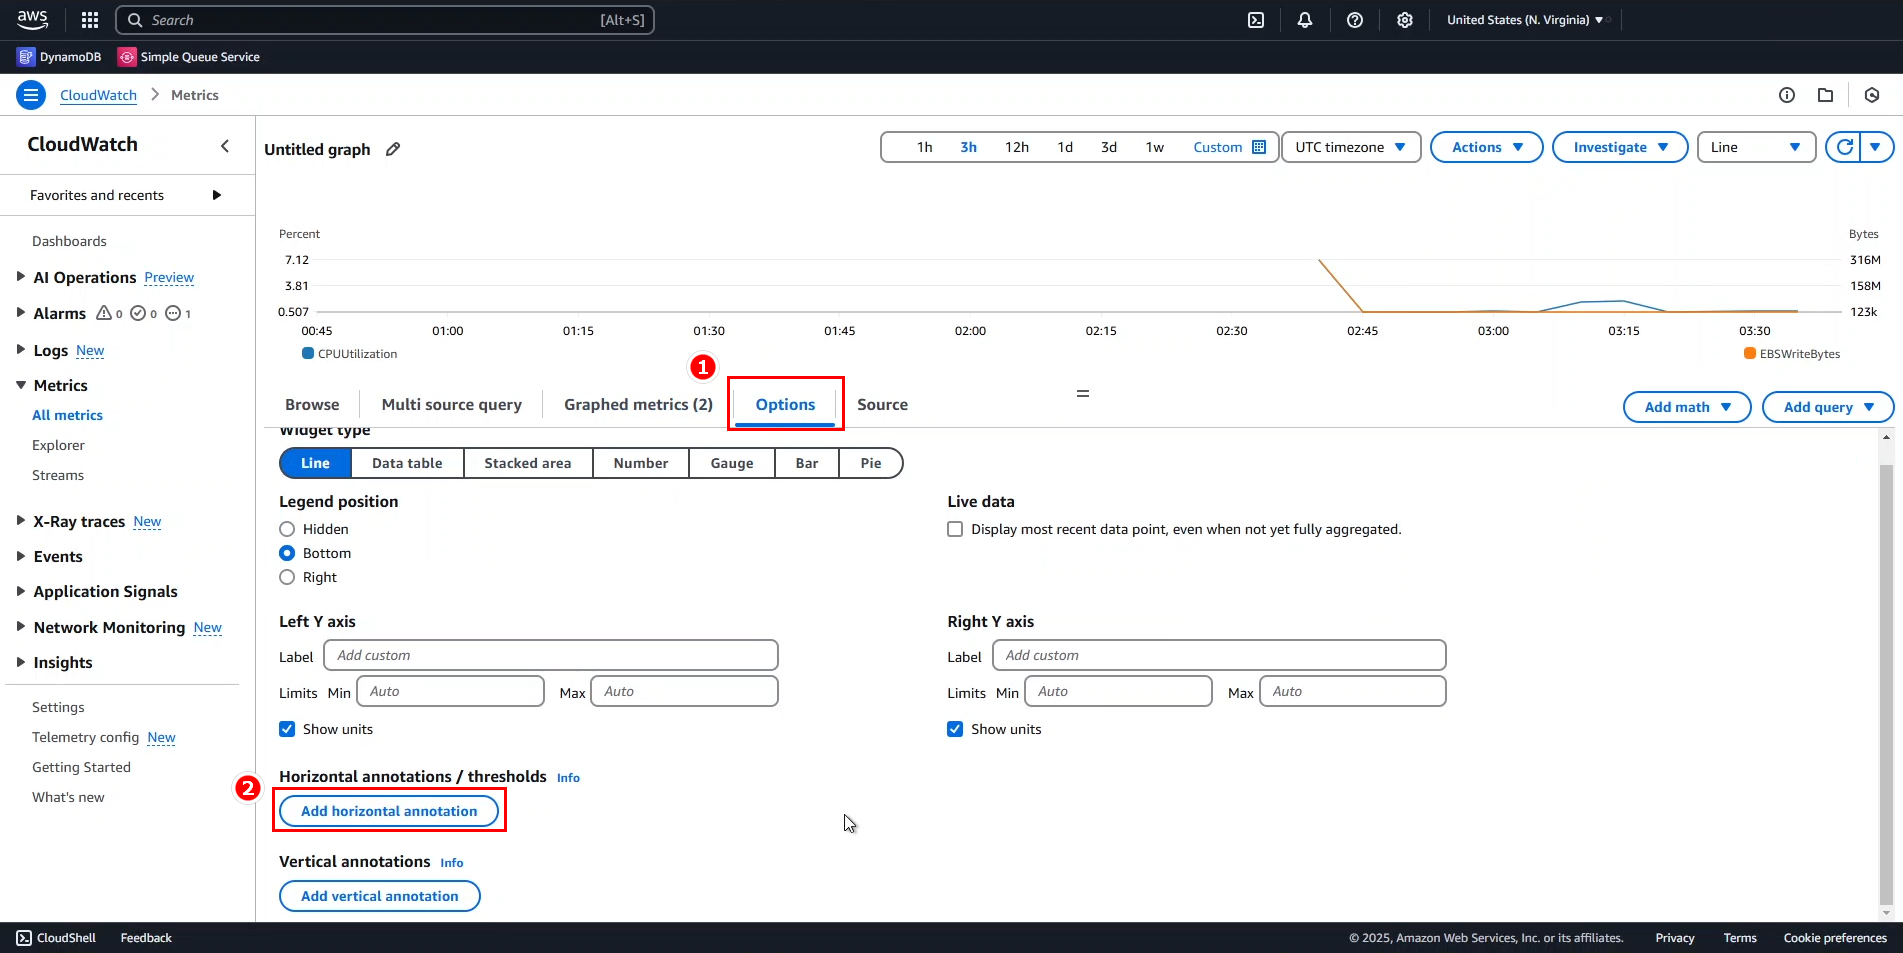
- Add a horizontal threshold annotation:
- Go to the Options tab.
- Click Add horizontal annotation.
- Configure the threshold:
- Label:
5% Mark - Value:
5 - This adds a dashed horizontal line at the 5% CPU utilization level.
- Label:
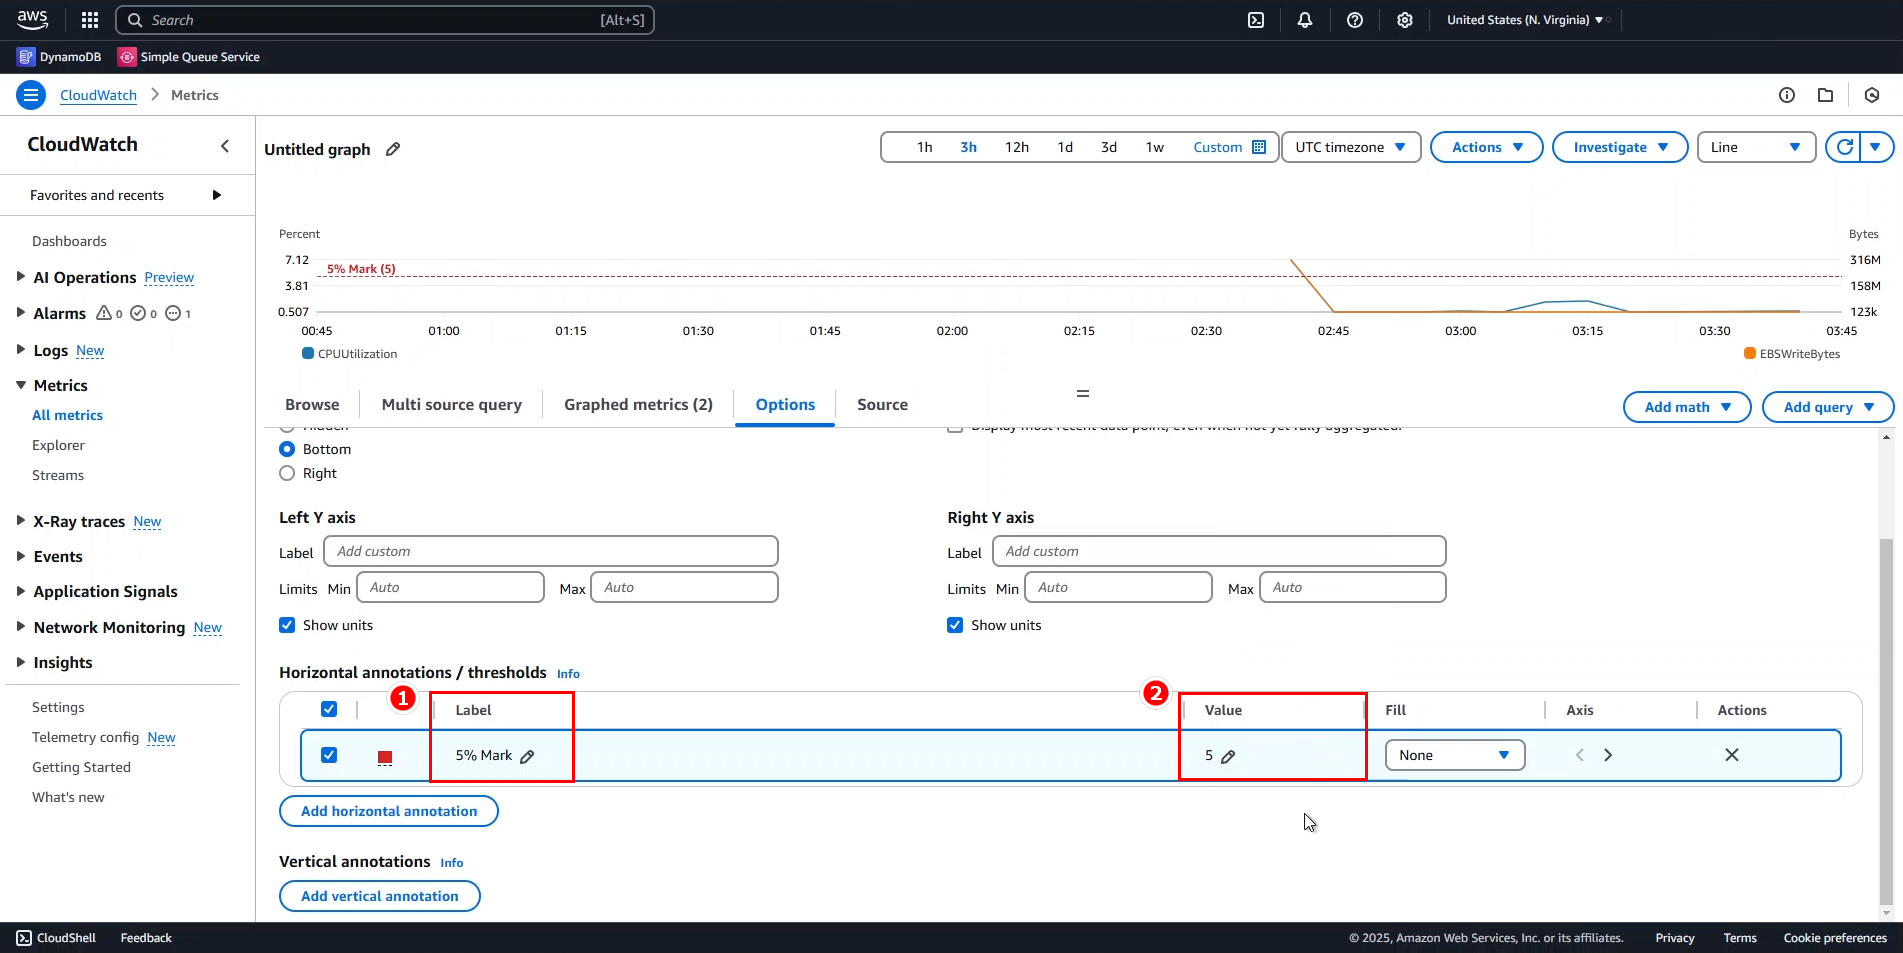
💡 Pro Tip: Horizontal annotations are excellent for visualizing thresholds that might trigger alarms or indicate performance boundaries.
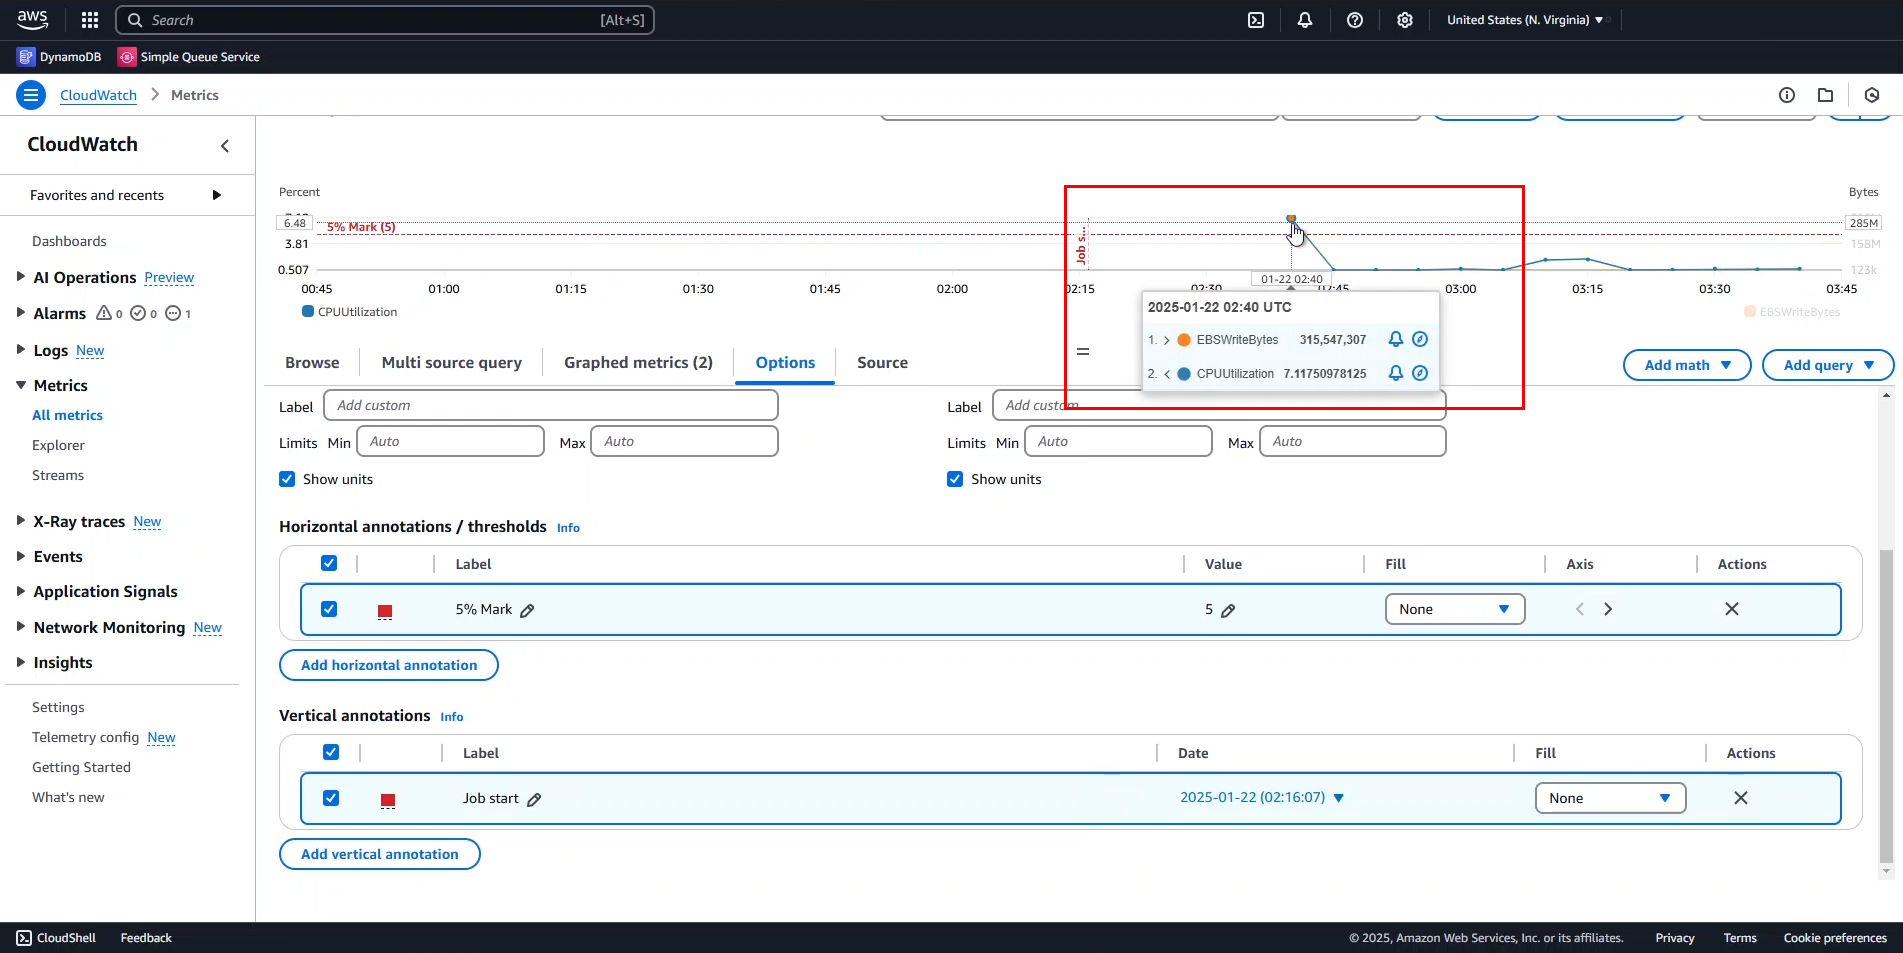
- Add a vertical event marker:
- Create a Vertical annotation labeled
Job start. - This adds a dashed vertical line to mark a specific point in time.
- Create a Vertical annotation labeled
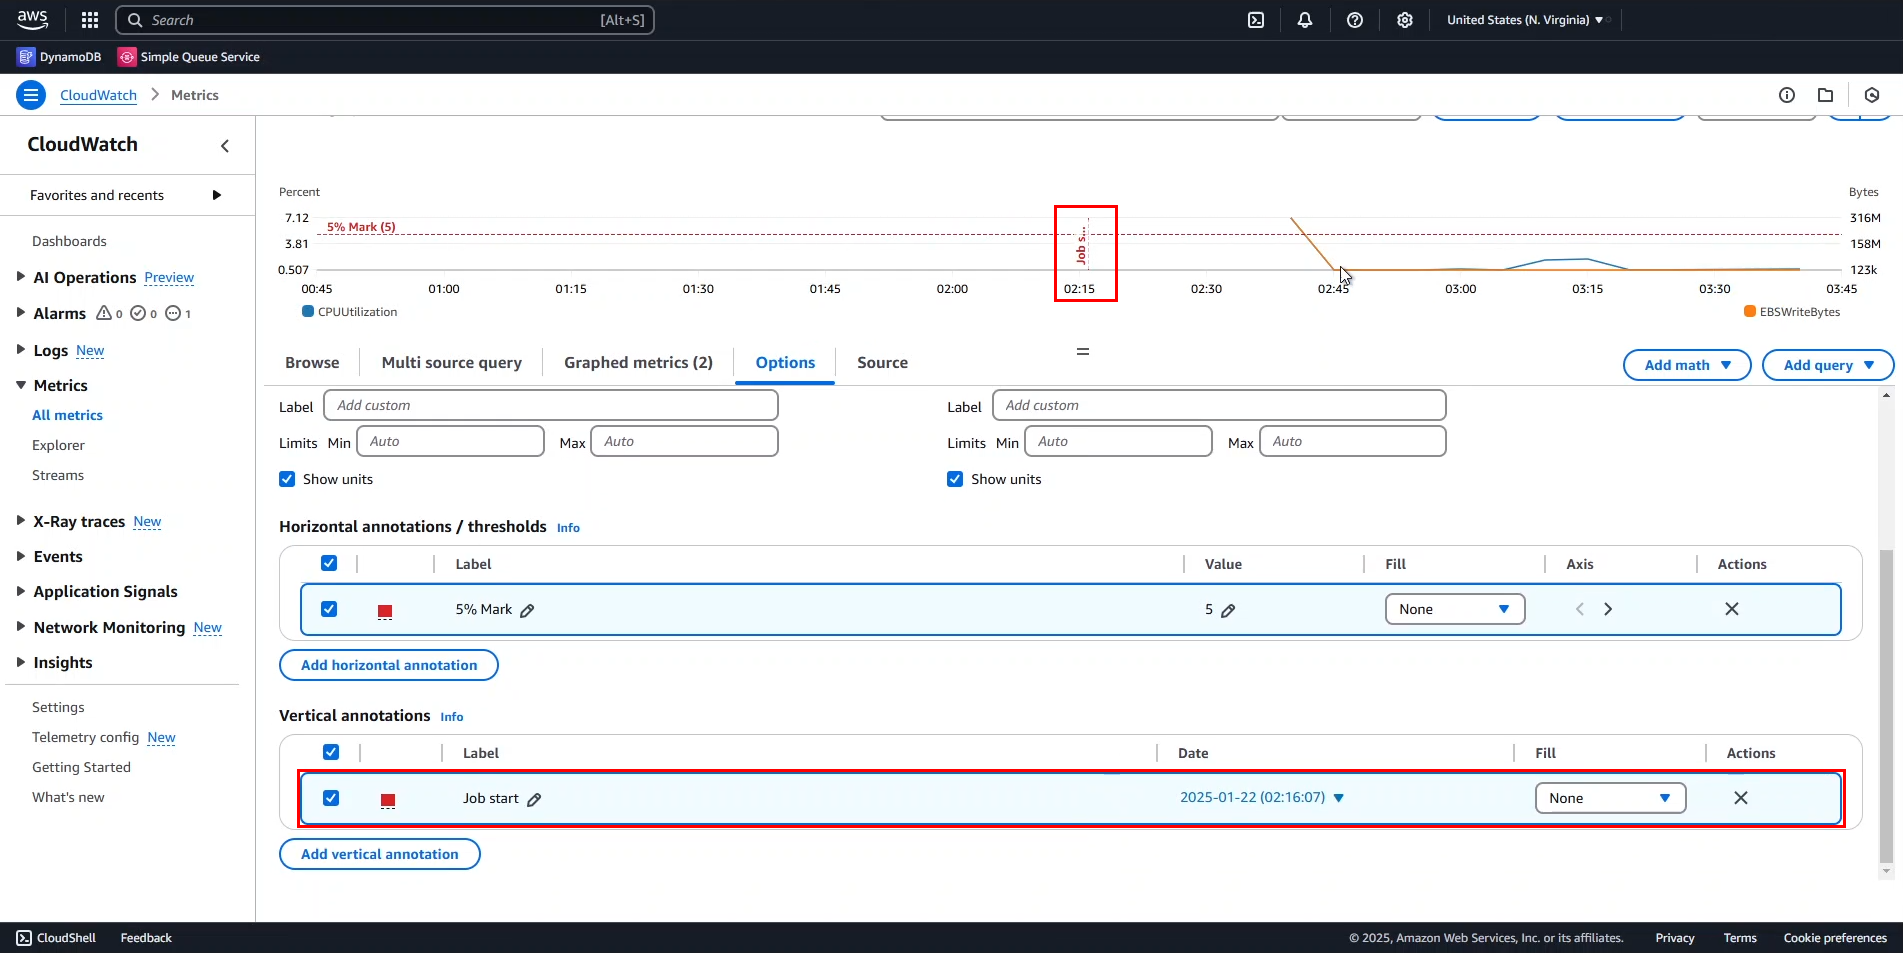
- Adjust the vertical annotation time:
- Hover over the Job start marker.
- Note that the job actually started around 2:40 AM.
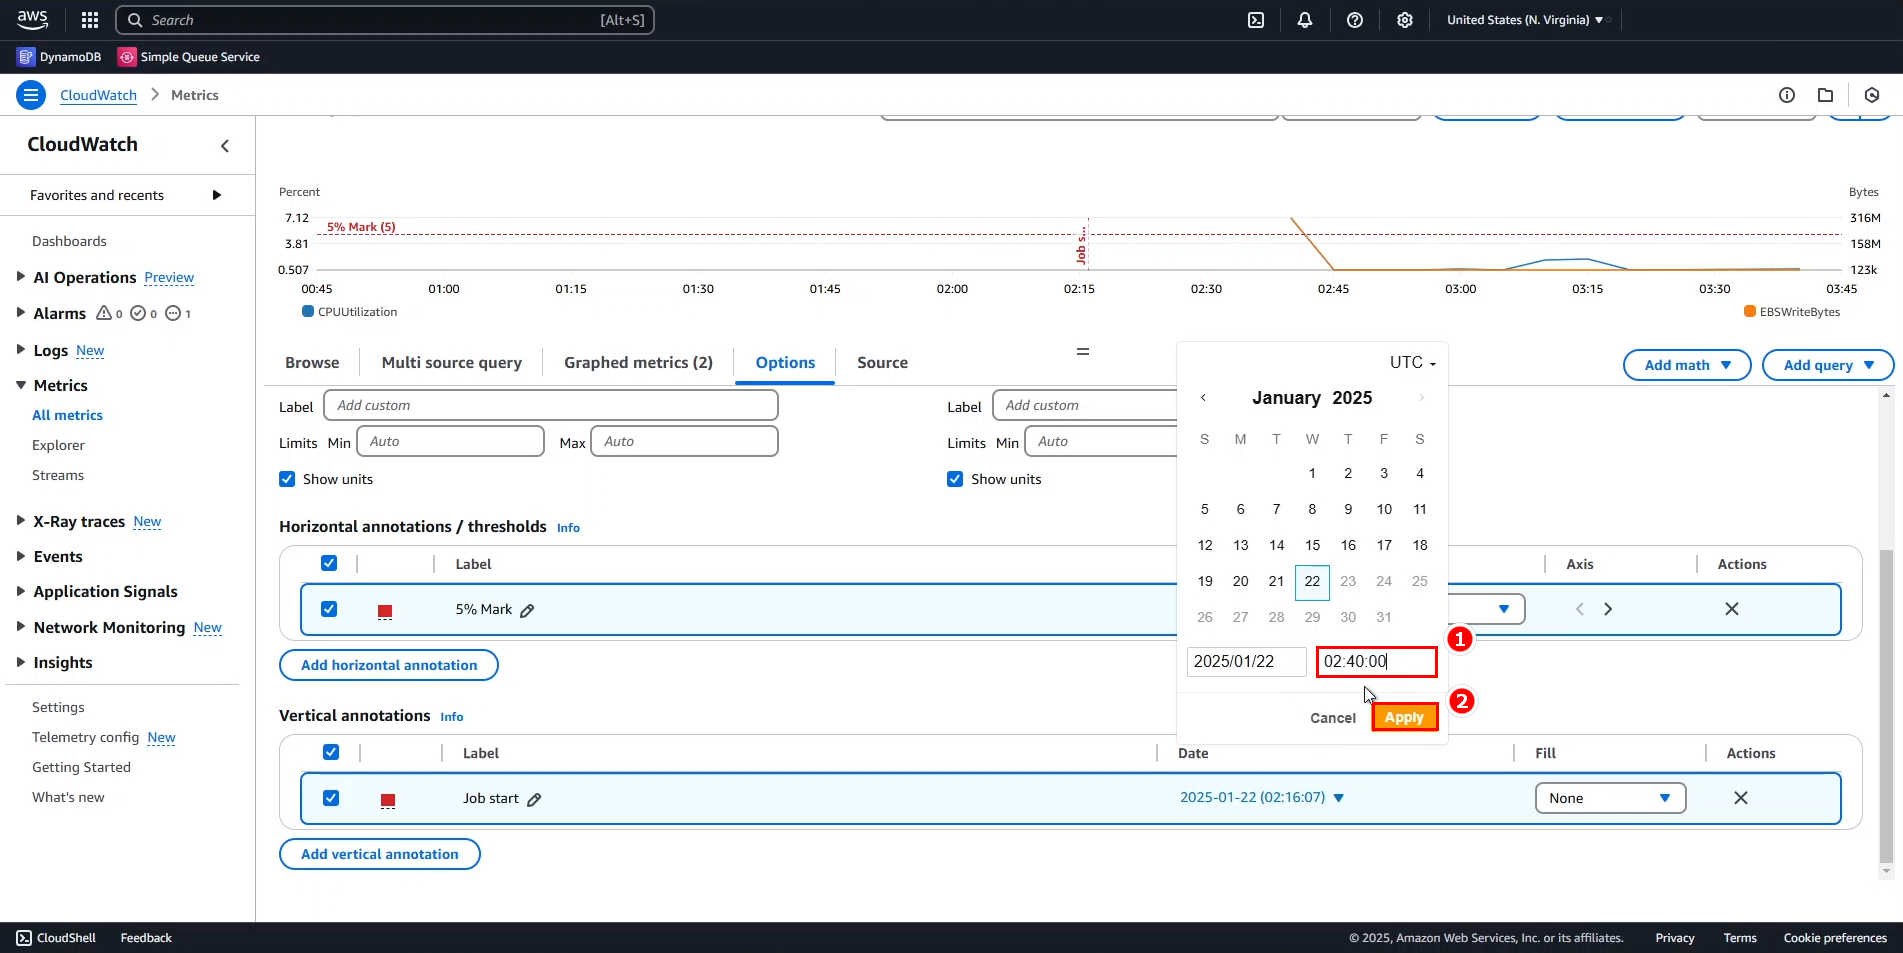
- Update the annotation:
- Change the Date/Time for
Job startto 2:40 AM. - Click Apply to save your changes.
- Change the Date/Time for
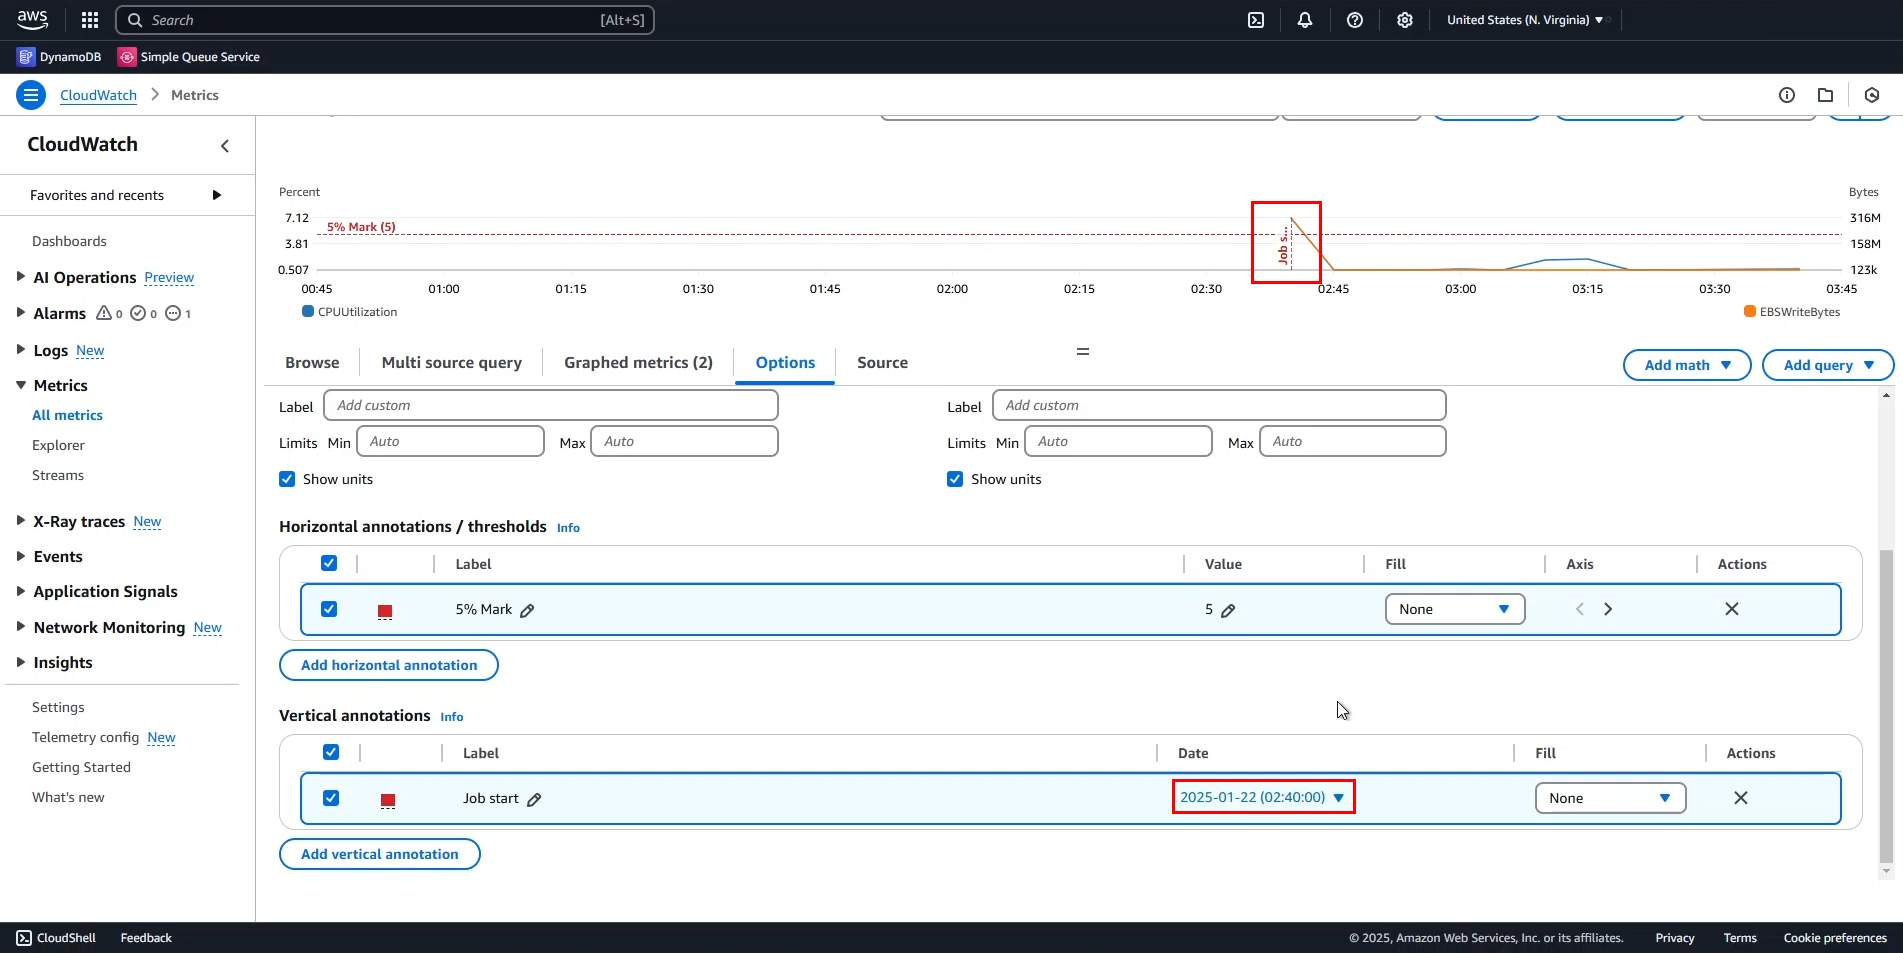
- Verify the repositioned marker:
- The
Job startmarker now aligns with the beginning of instance activity.
- The
🔒 Security Note: When analyzing metrics for production workloads, pay special attention to unexpected spikes or patterns that might indicate security events or unauthorized access.
Next Steps
This concludes our exploration of basic CloudWatch metric visualization. In the next section, we’ll dive into working with metric expressions for more advanced analysis capabilities.
⚠️ Warning: Before proceeding to the next section, you may want to remove the annotations to start with a clean workspace.