CloudWatch Metric Filter
Creating a CloudWatch Metric Filter
ℹ️ Information: CloudWatch Metric Filters allow you to extract and transform log data into numerical CloudWatch metrics that you can graph or set alarms on.
-
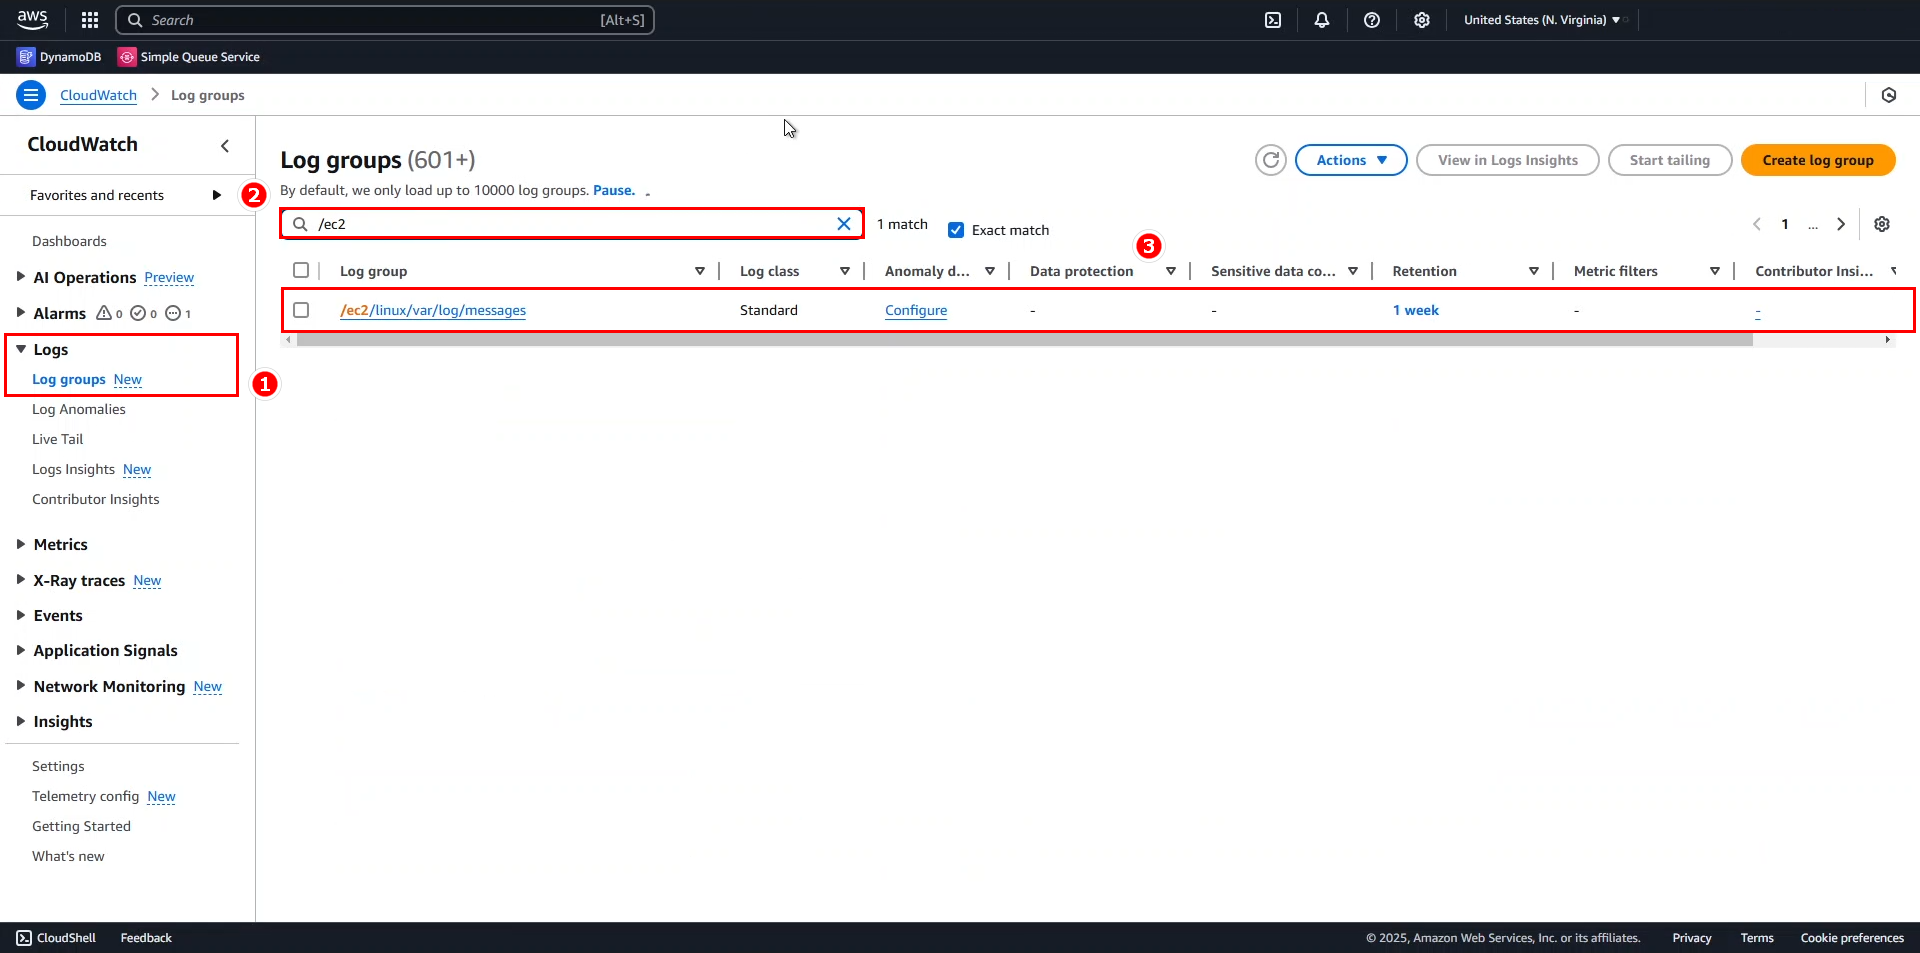
Return to the main screen of Amazon CloudWatch
- Select Log groups from the navigation pane
- Search for
/ec2in the filter box - Select /ec2/linux/var/log/messages log group
-
In the /ec2/linux/var/log/messages log group interface
- Click on Actions dropdown menu
- Select Create metric filter

-
In the Define Pattern section, configure the following:
- Filter pattern: select ERROR from the dropdown menu
- Test pattern: select any log stream instance (preferably the instance where we created processes in the previous steps)
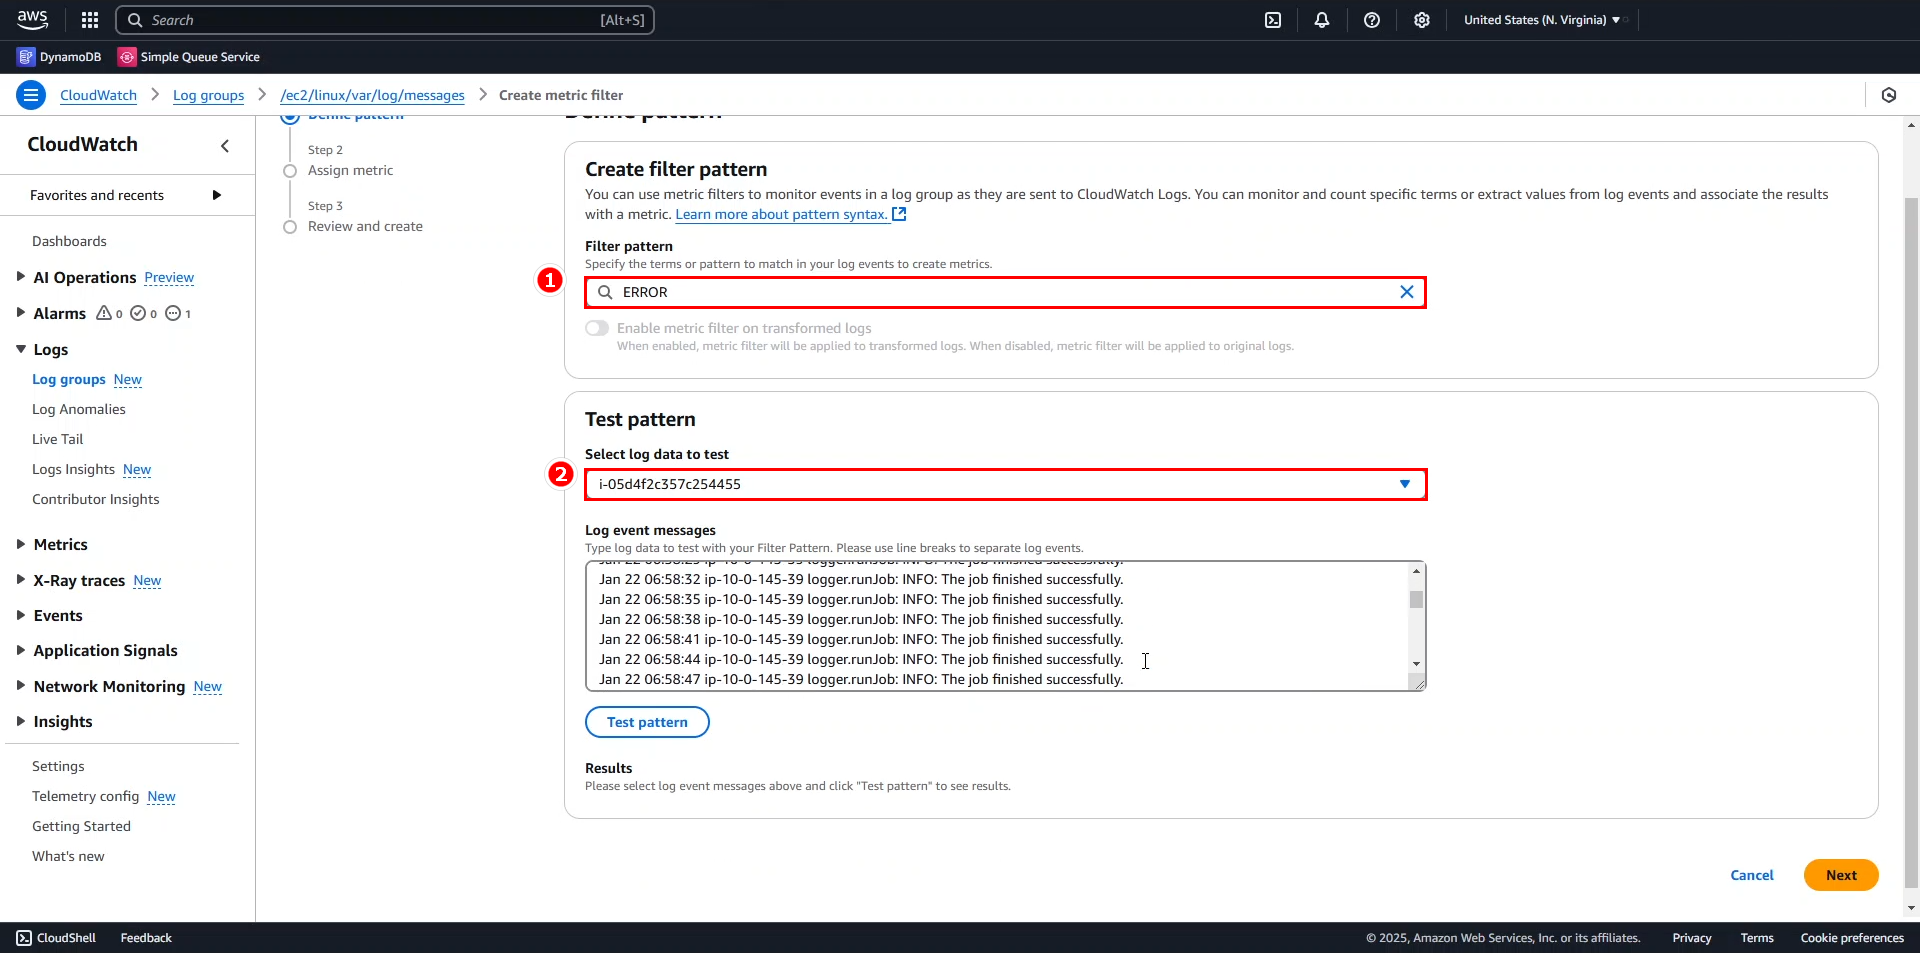
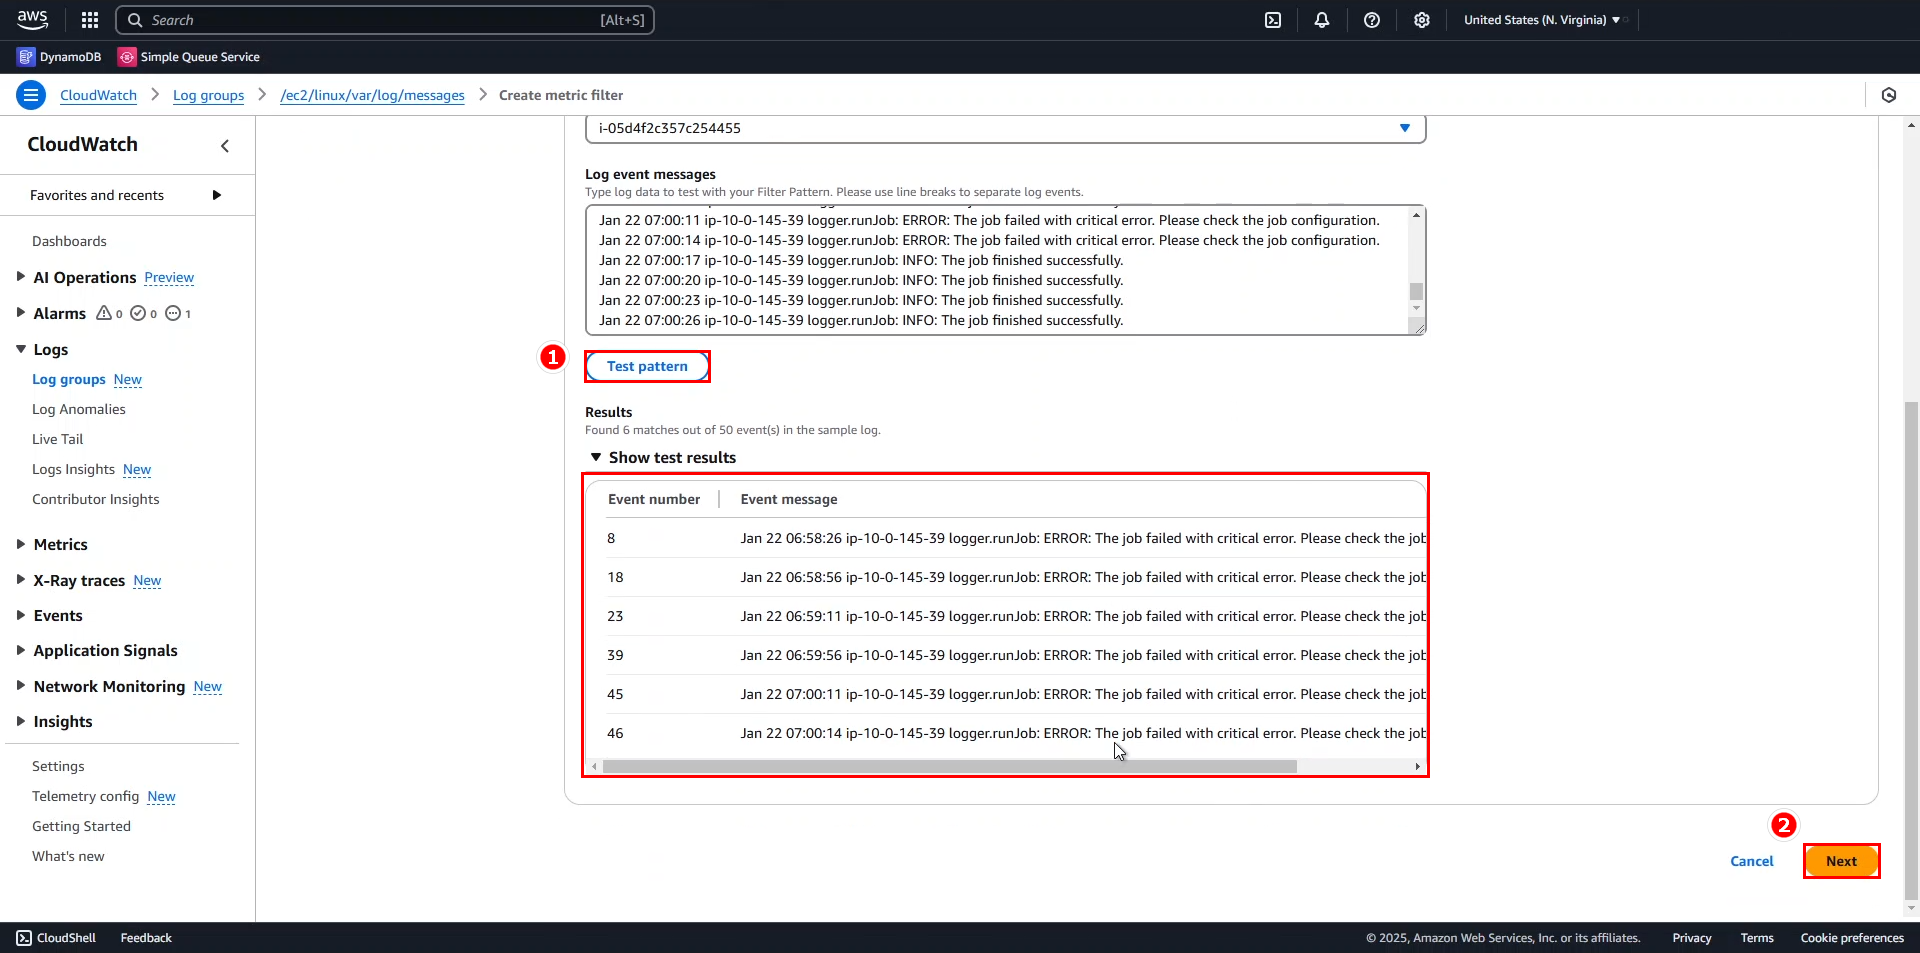
- Click Test pattern to validate the filter configuration
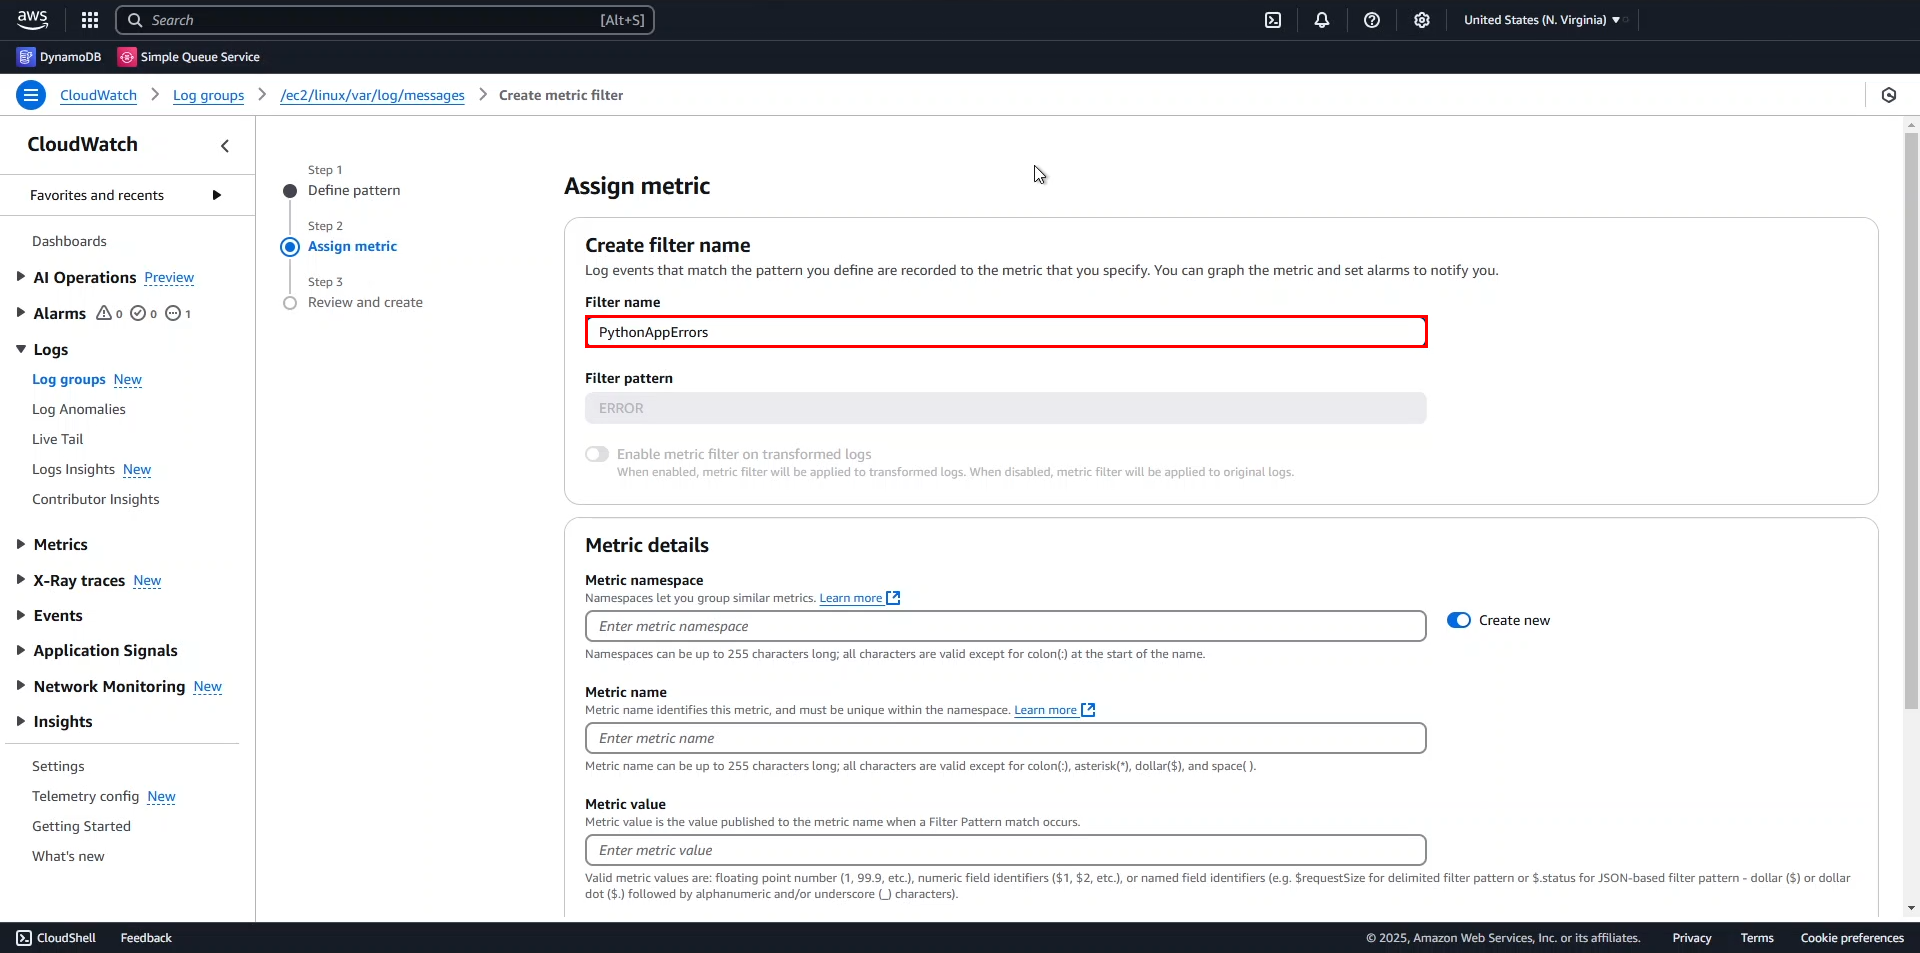
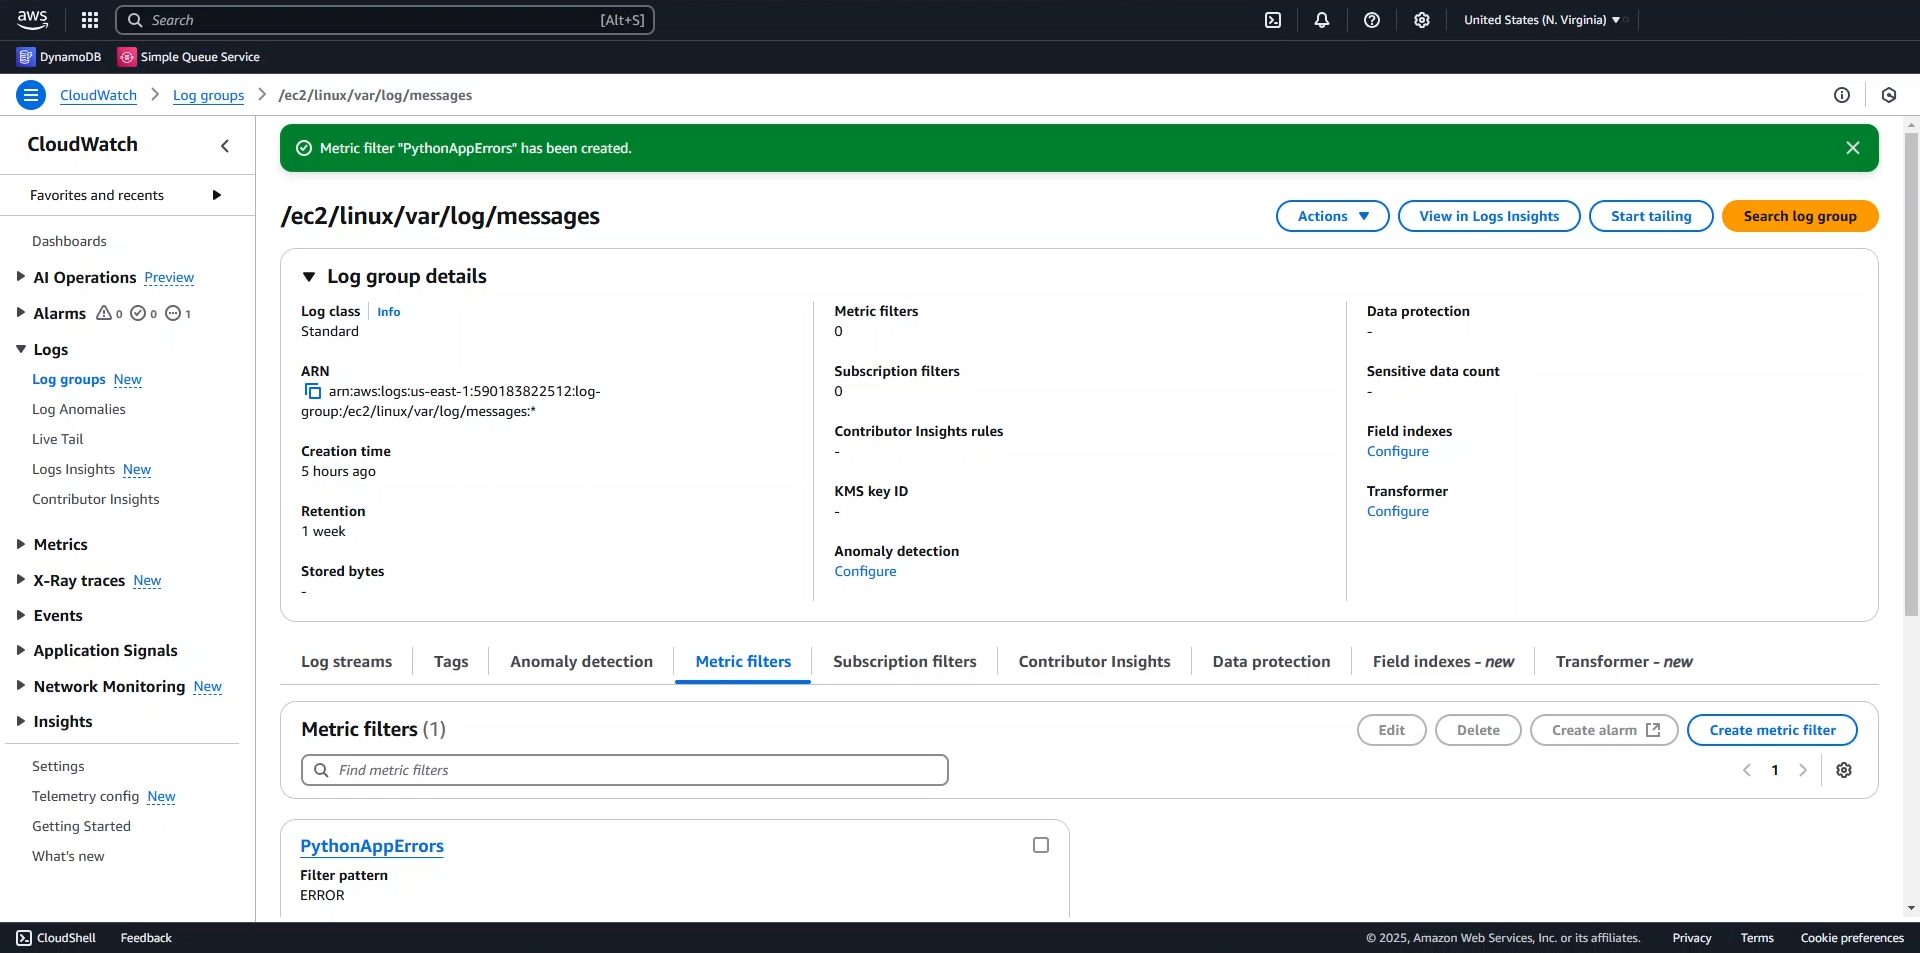
- In the Create filter name section of Assign metric, enter
PythonAppErrors
-
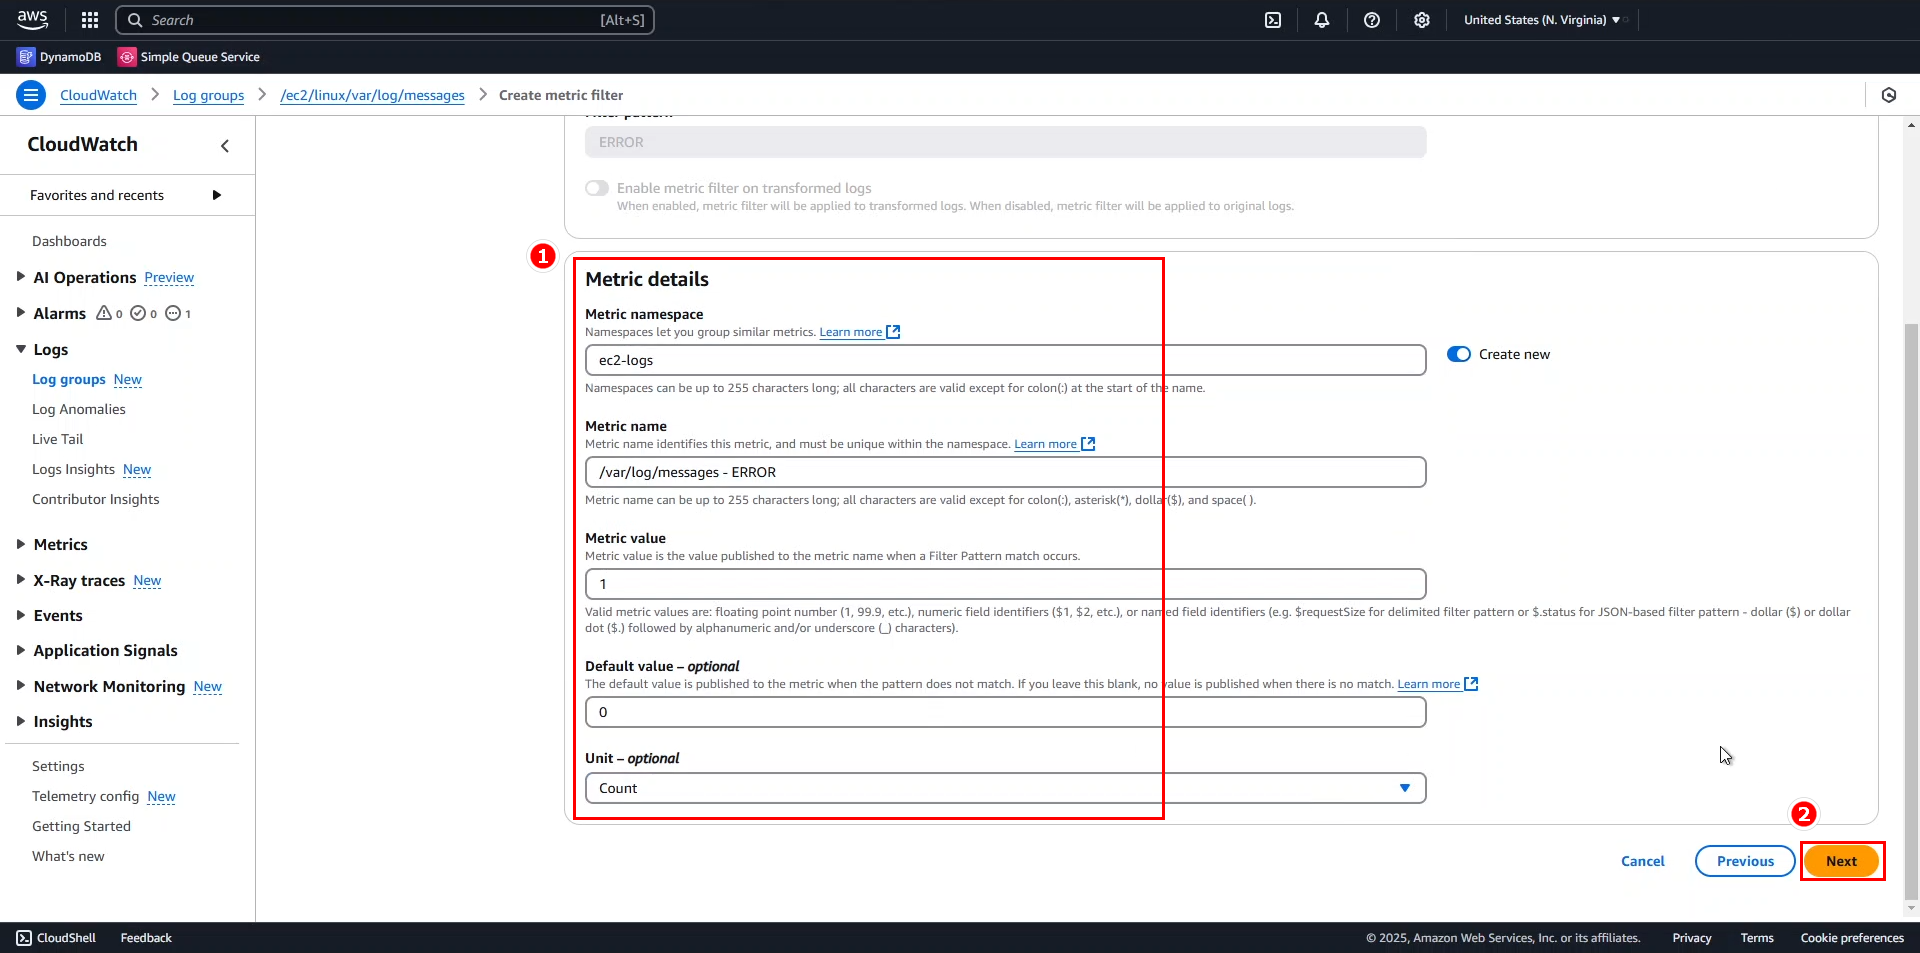
In the Metric details section, configure the following:
- Metric namespace:
ec2-logs - Metric name:
/var/log/messages - ERROR - Metric value: 1
- Default value: 0
- Unit: select Count from the dropdown menu
- Click Next
- Metric namespace:
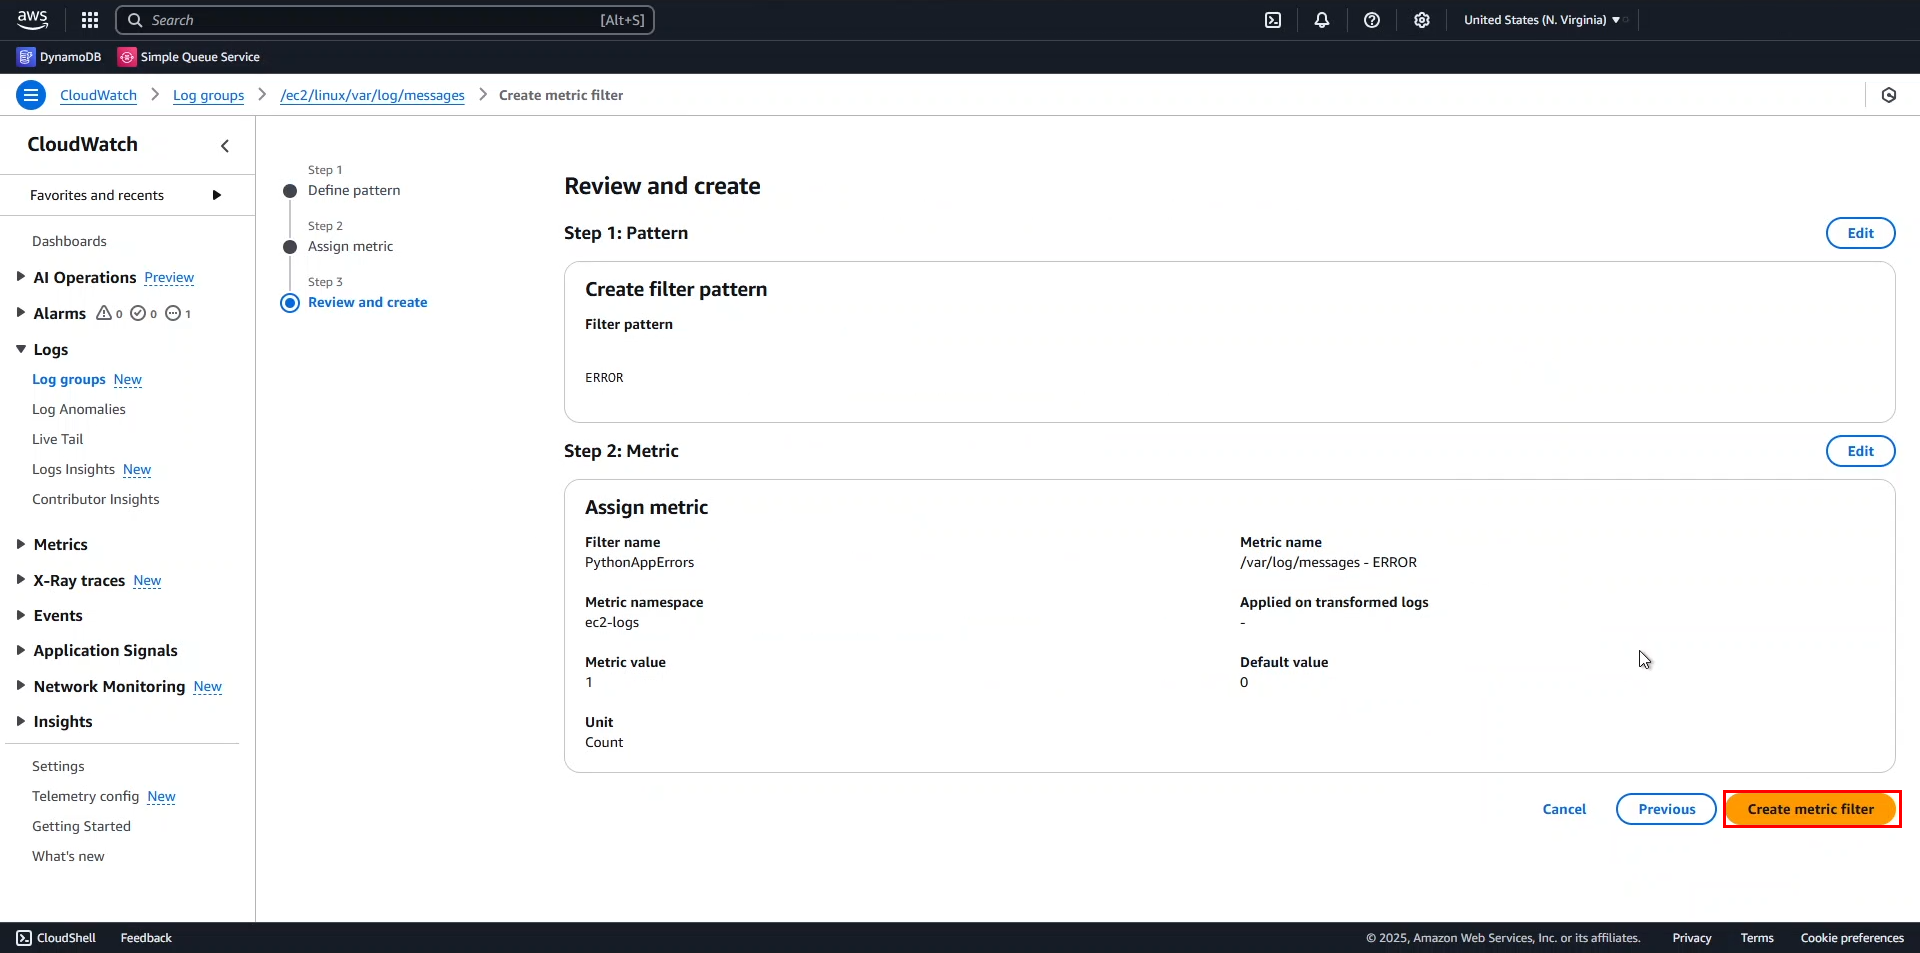
- Review your configuration and click Create metric filter
-
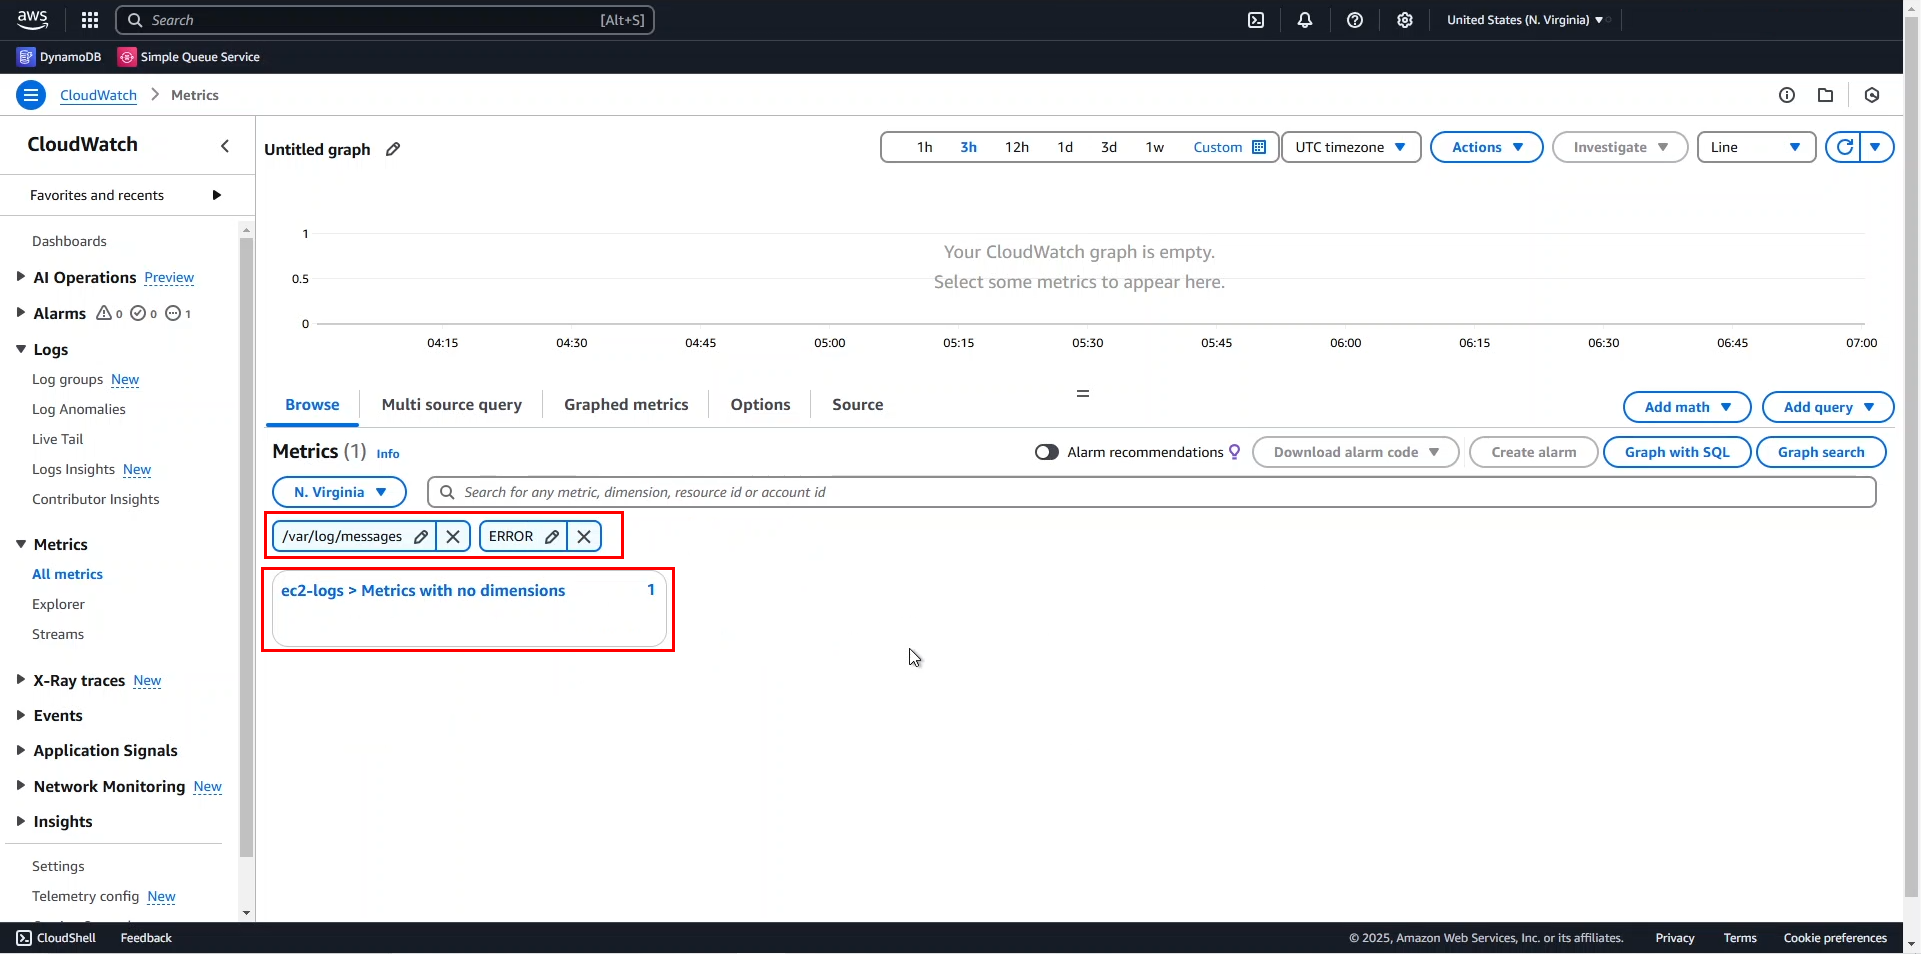
Navigate to Metrics > All metrics in the CloudWatch console
- Search for the keywords
/var/log/messagesandERROR - Select ec2-logs > Metrics with no dimensions
- Search for the keywords

💡 Pro Tip: You can create multiple metric filters for different error patterns or log events to gain comprehensive visibility into your application’s behavior.
🔒 Security Note: Ensure that your metric filters don’t extract sensitive information that might be present in your logs.
Now we have a metric that captures ERROR logs from the application. In the next step, we will set up a CloudWatch Alarm for this metric to receive notifications when errors occur.