CloudWatch Alarms
Amazon CloudWatch Alarms
ℹ️ Information: CloudWatch Alarms monitor your metrics and trigger actions when thresholds are breached. They’re essential for proactive monitoring and automated responses to changing conditions in your AWS environment.
Follow these steps to create an alarm for the error log metric we configured in the previous section:
-
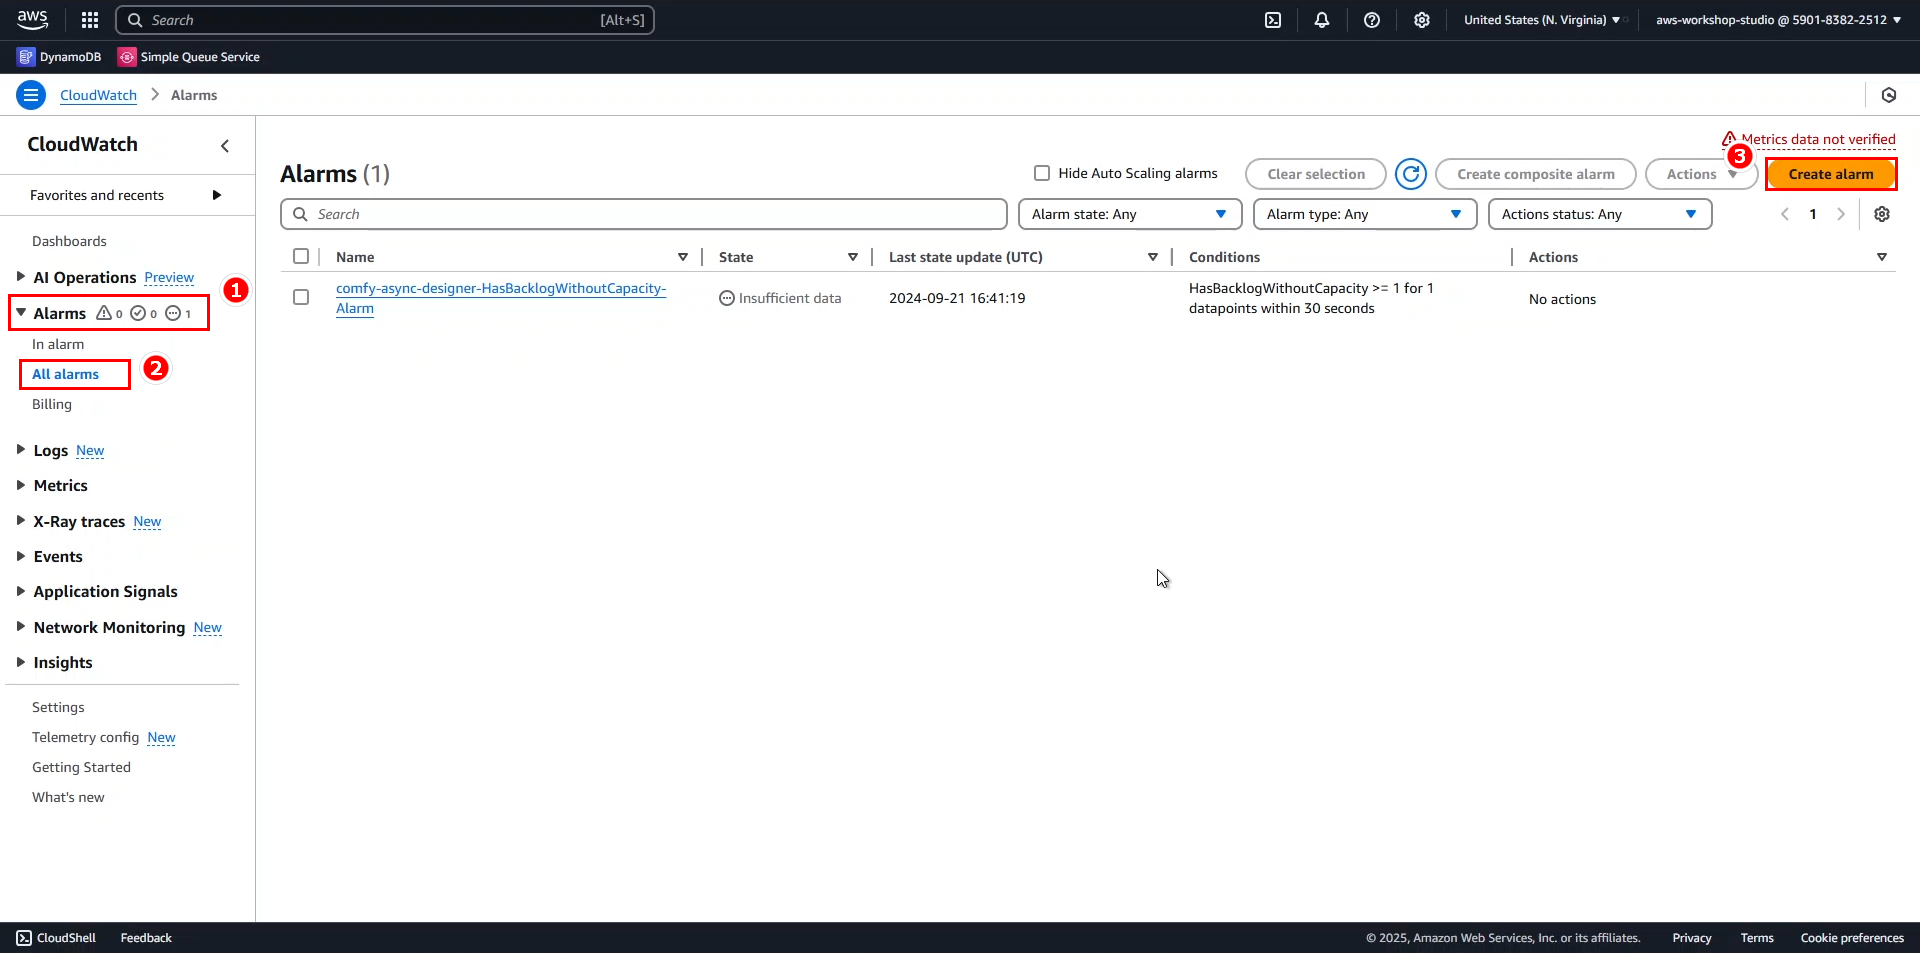
Navigate to the CloudWatch console:
- Select Alarms from the left navigation pane
- Choose All alarms
- Click Create alarm
-
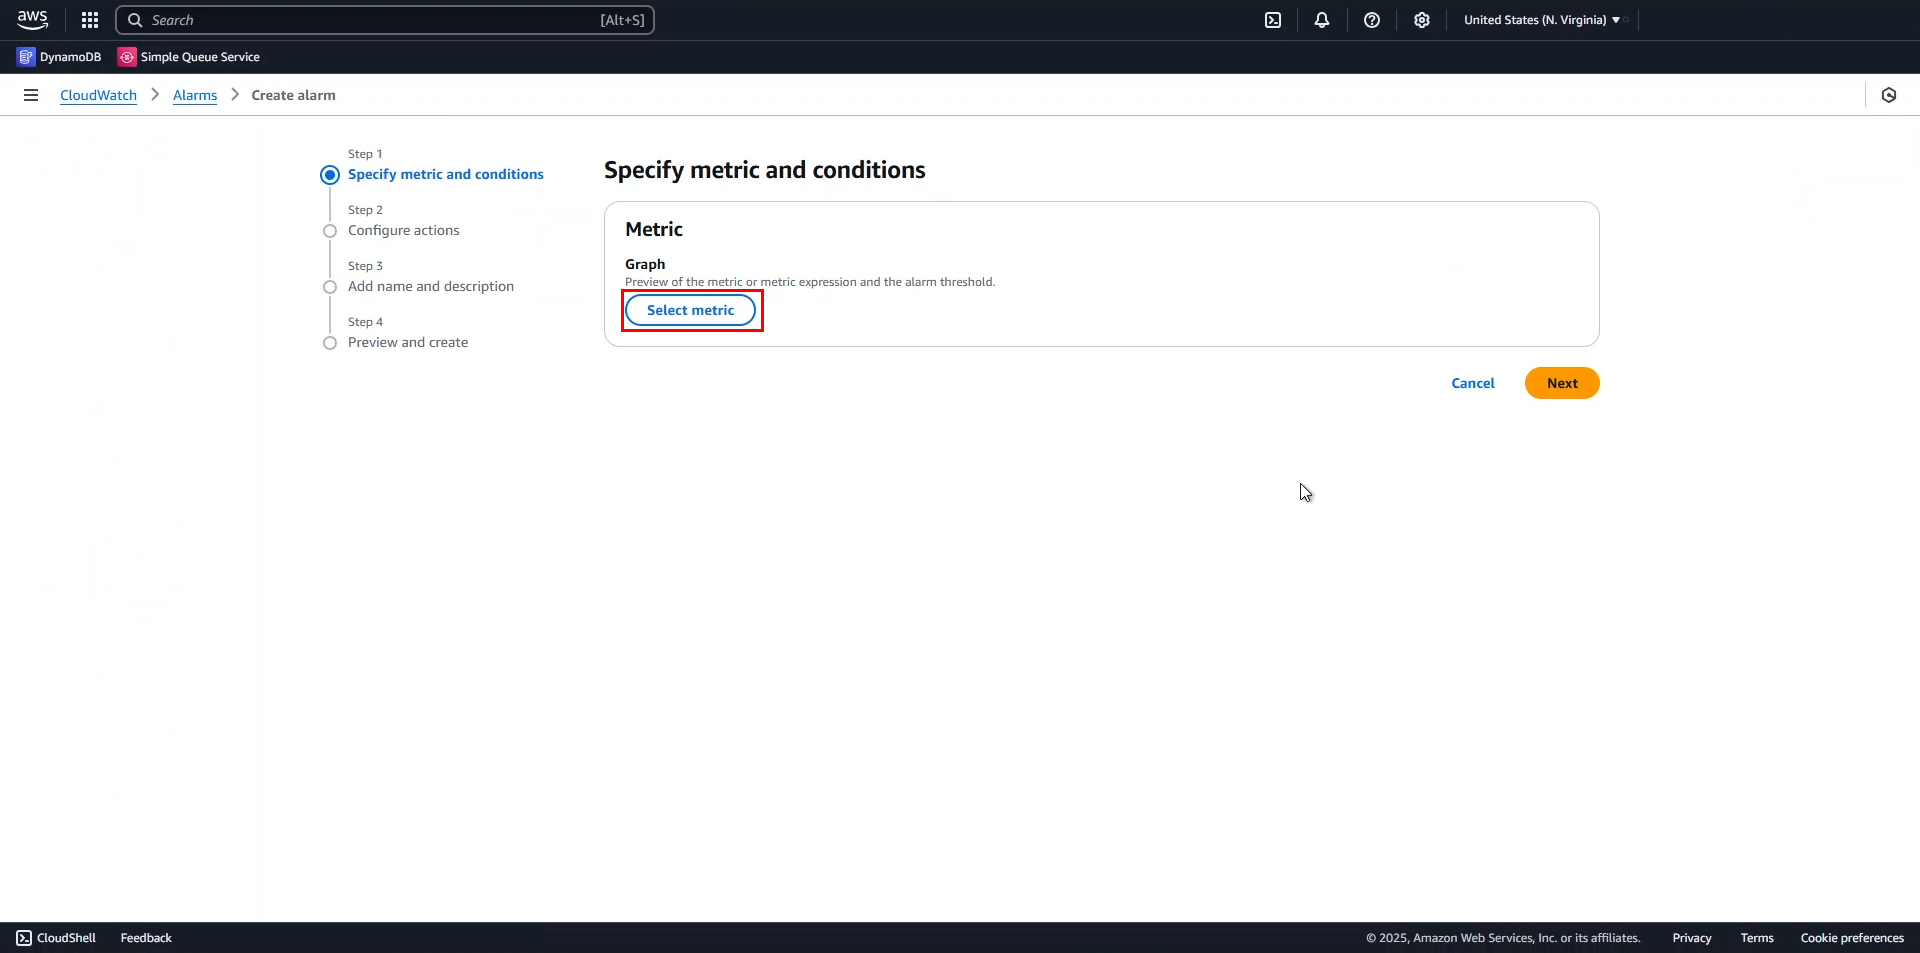
Begin the metric selection process:
- Click Select metric
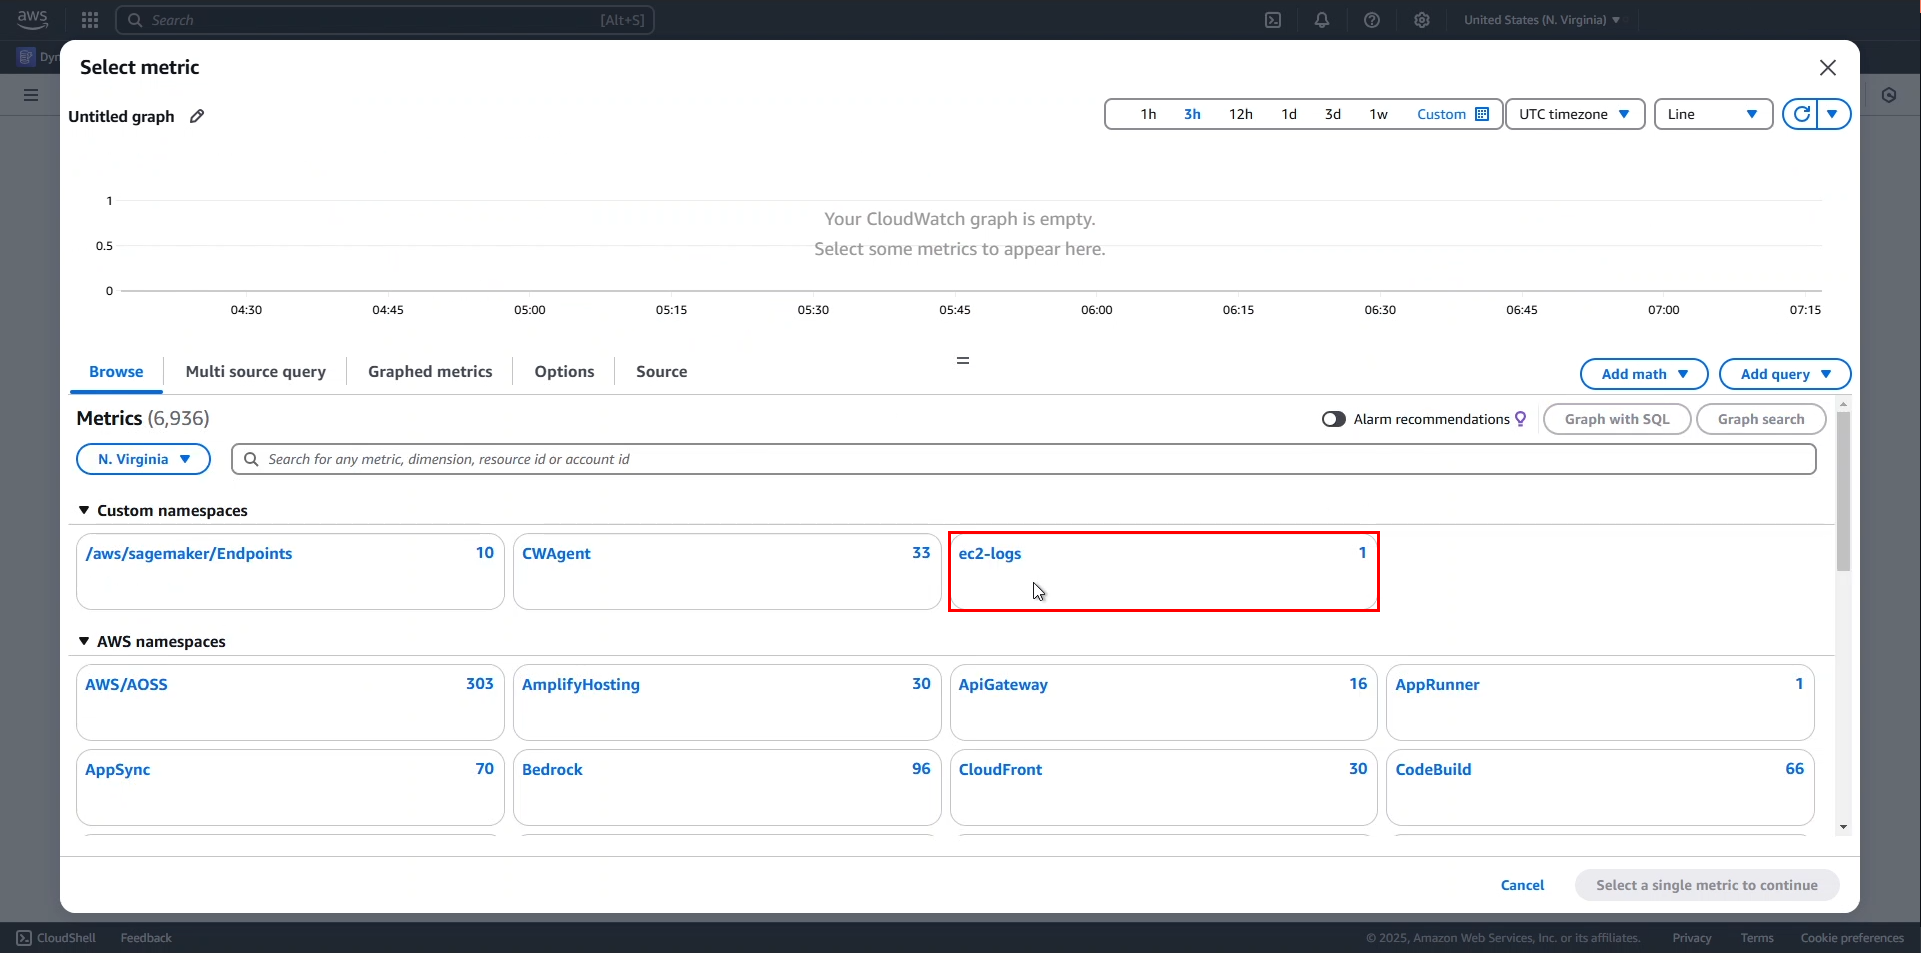
- Under Custom namespaces, select ec2-logs
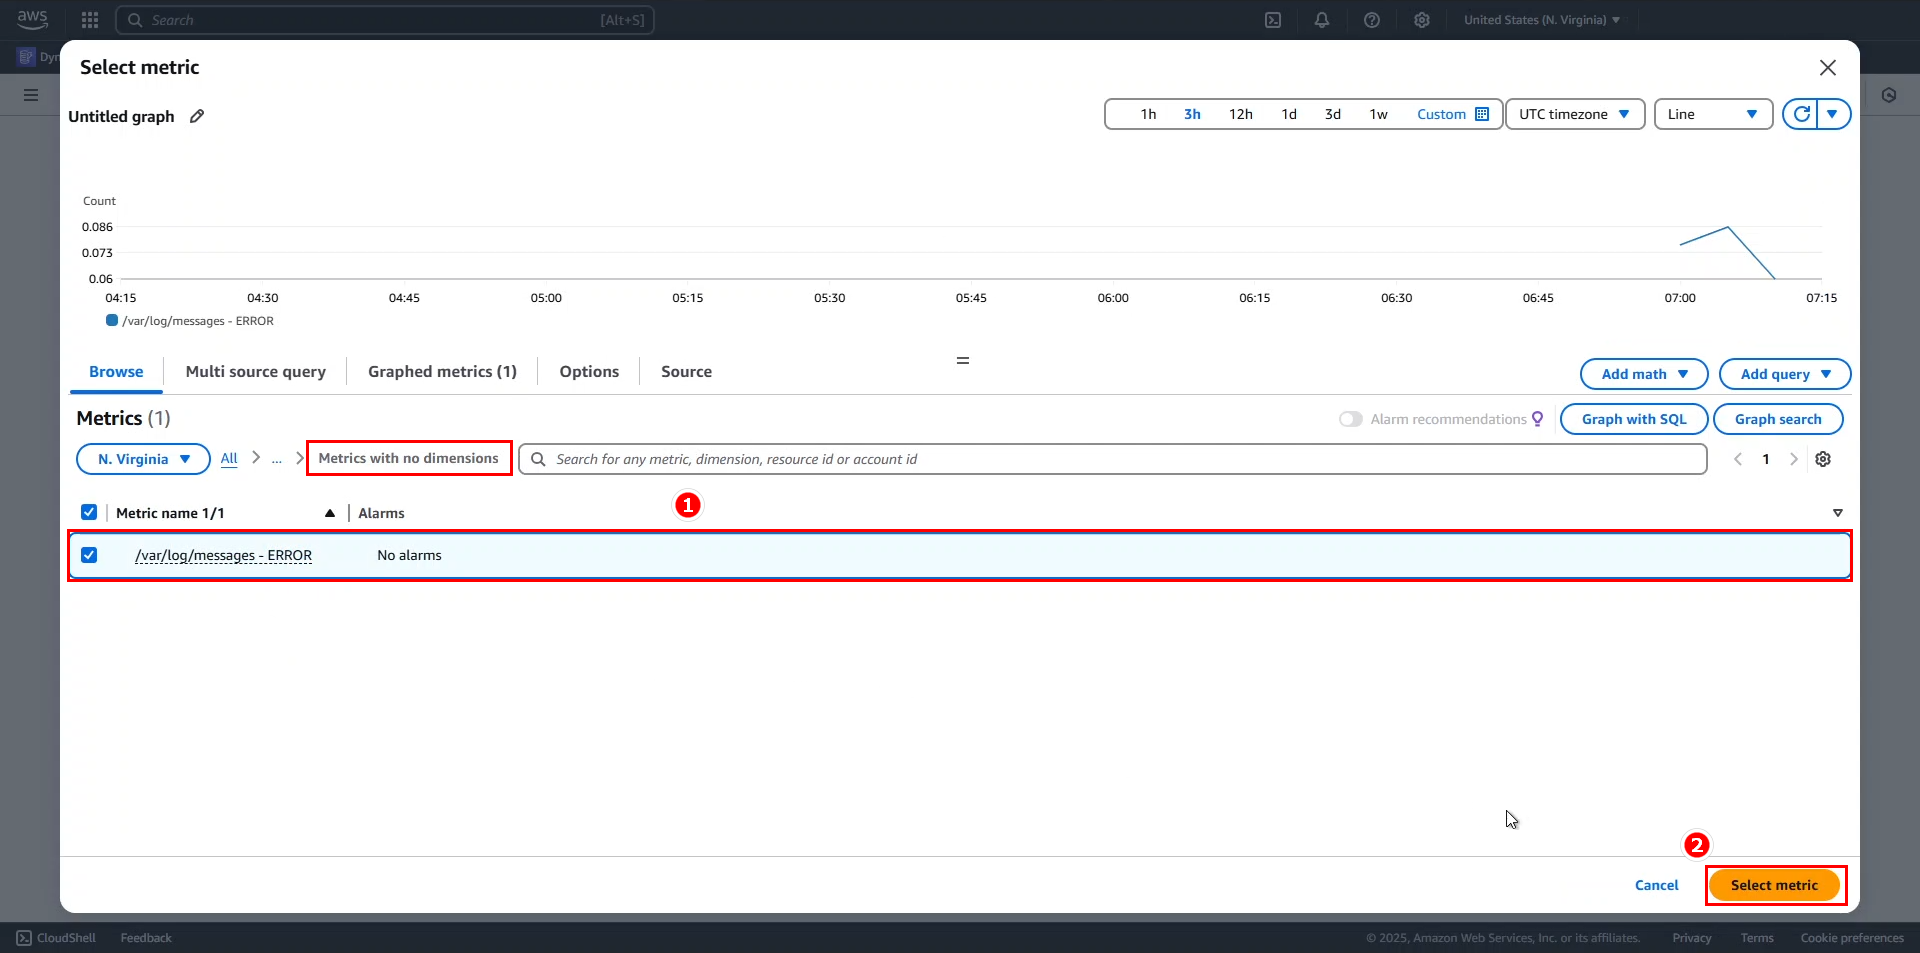
- Select Metrics with no dimensions
- Choose /var/log/messages - ERROR metric
- Click Select metric
-
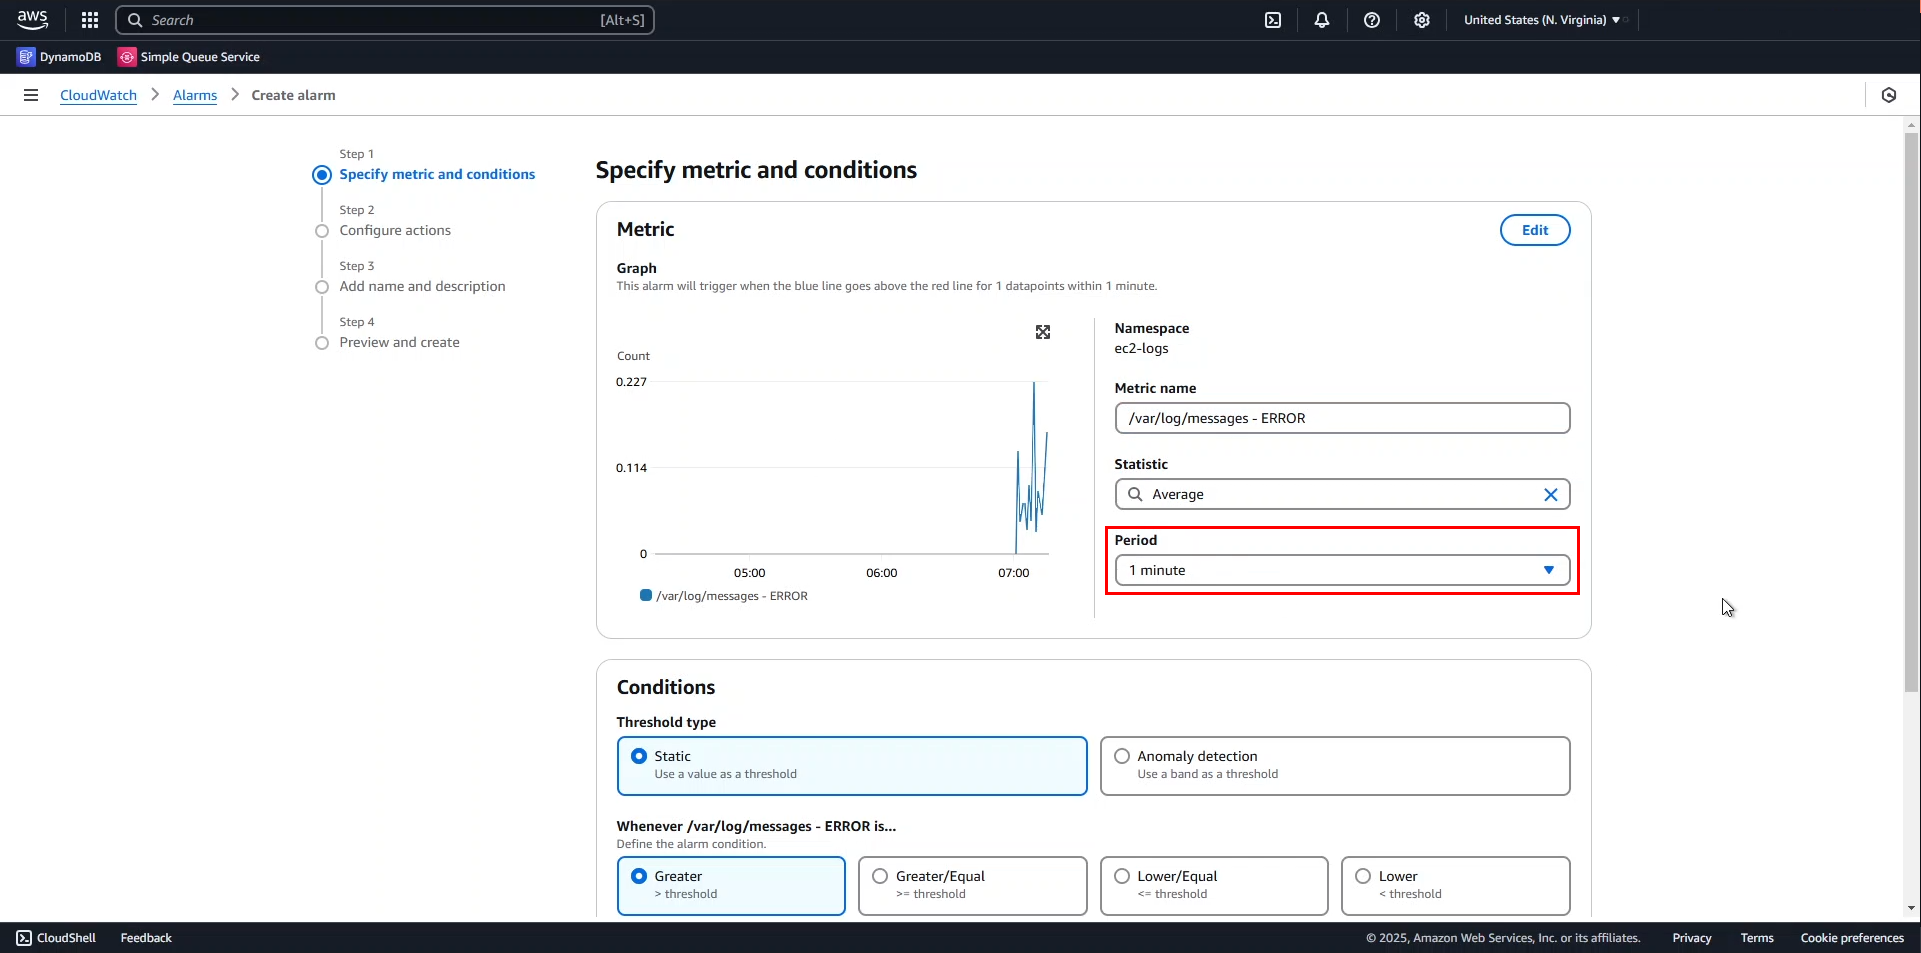
Configure the metric parameters:
- Set Period to 1 minute for timely detection of error spikes
-
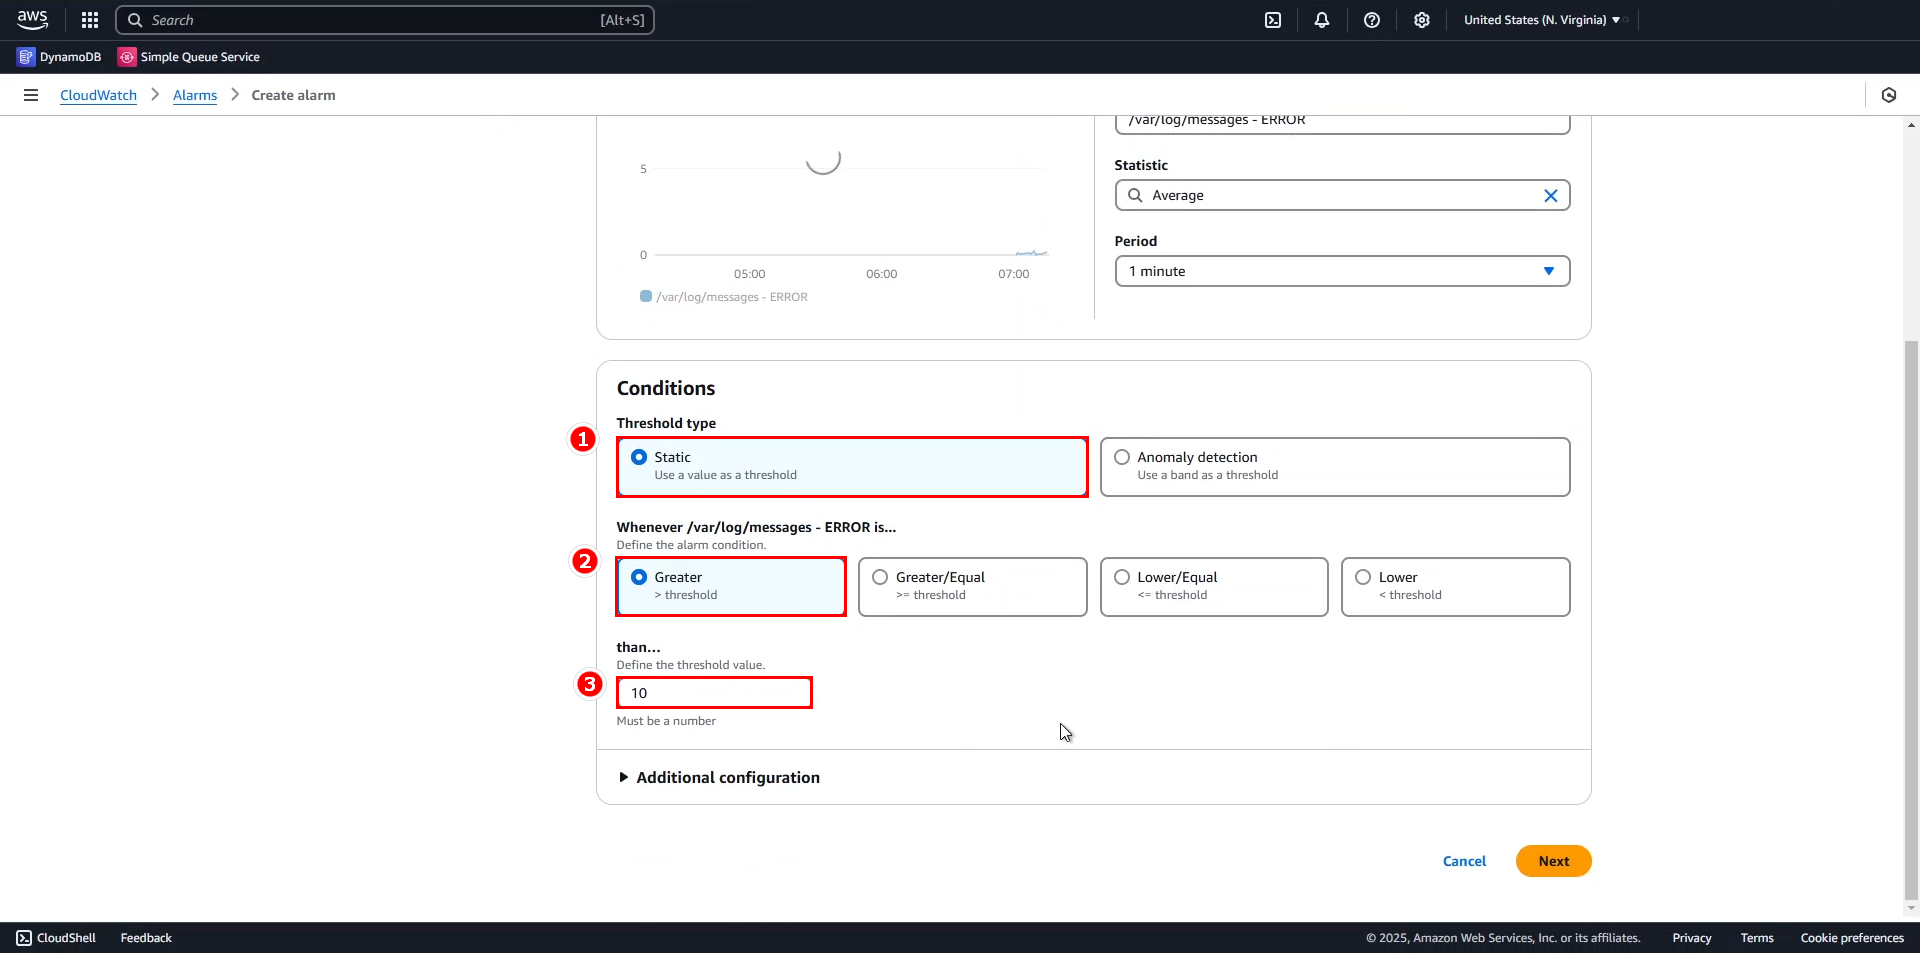
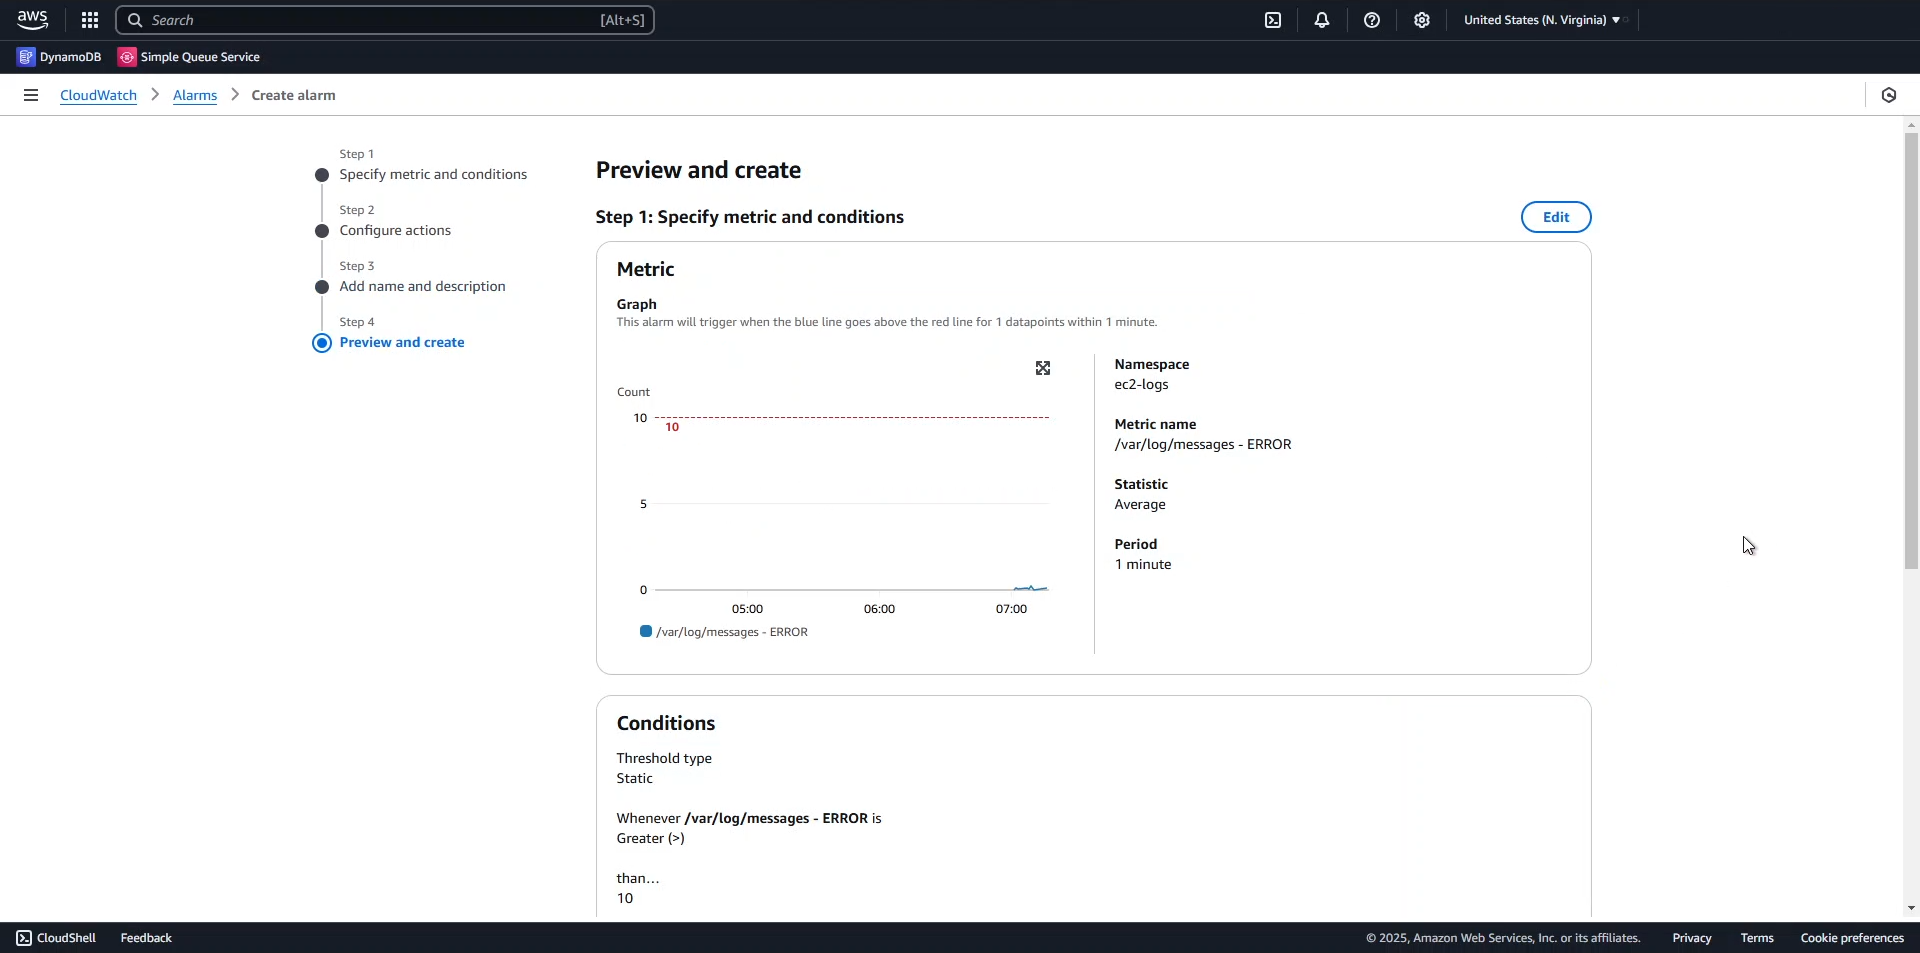
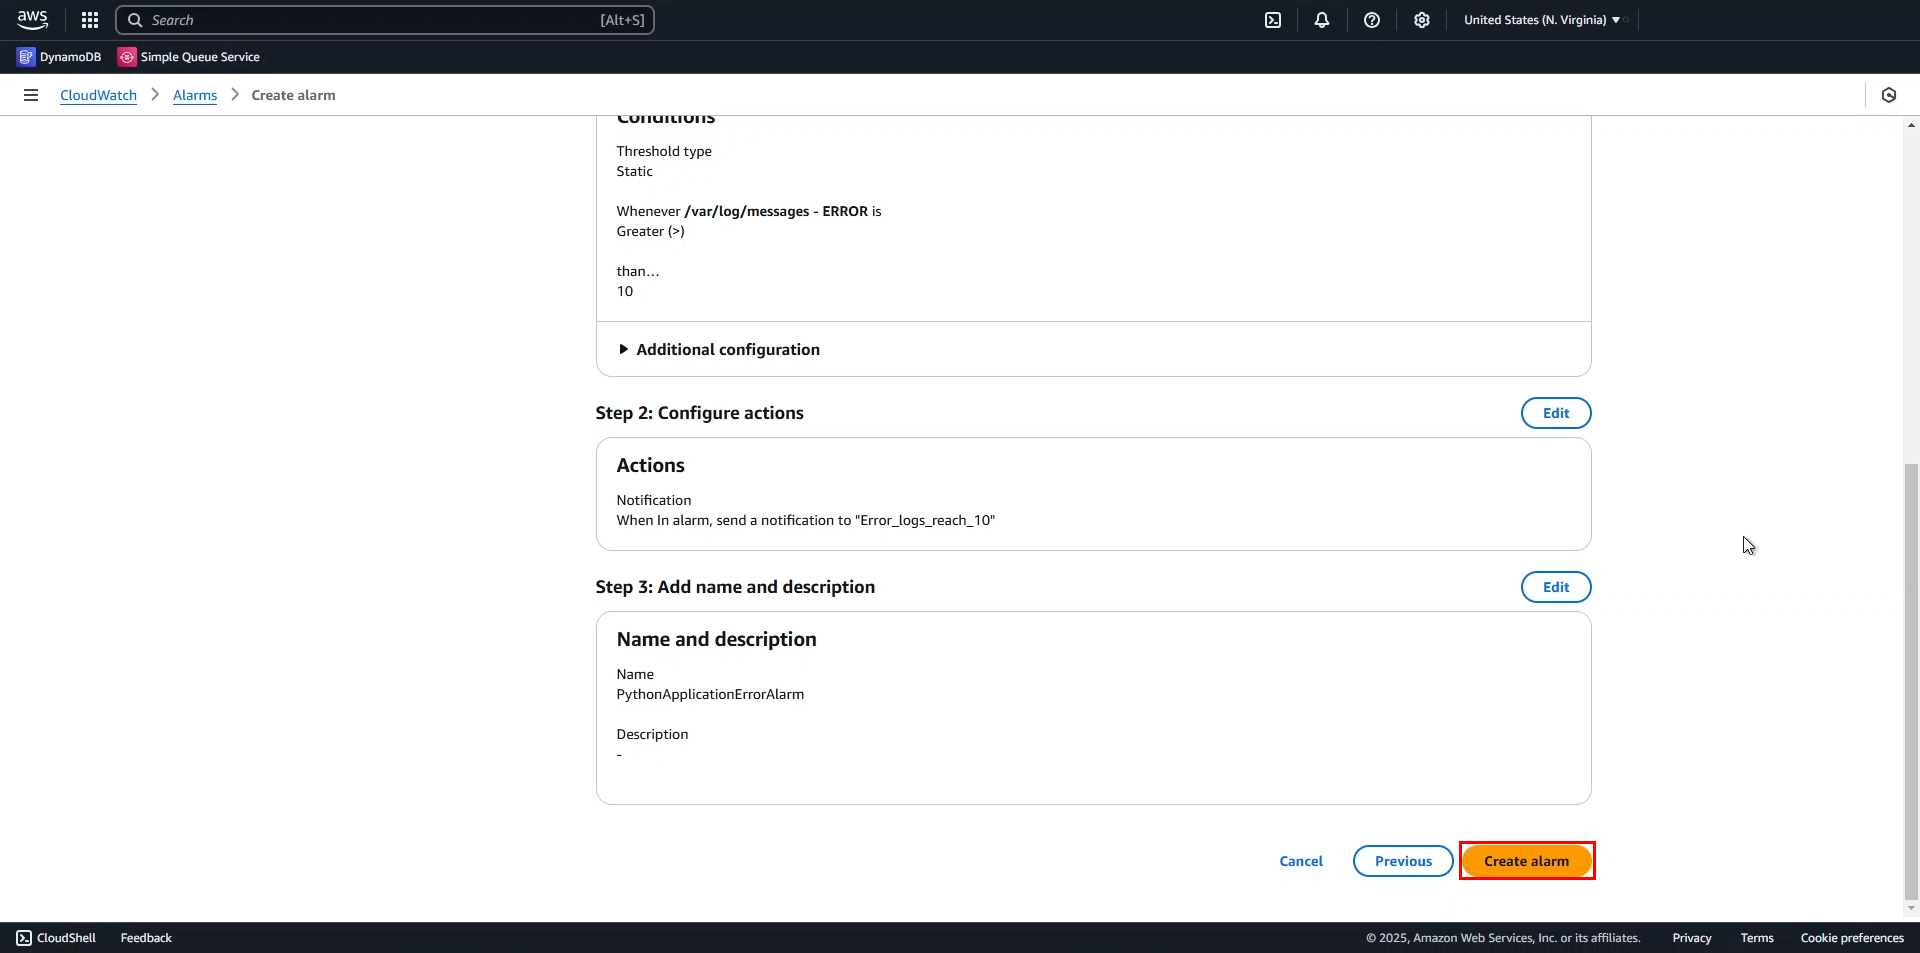
Define the alarm conditions:
- Threshold type: Static
- Condition: Greater than 10
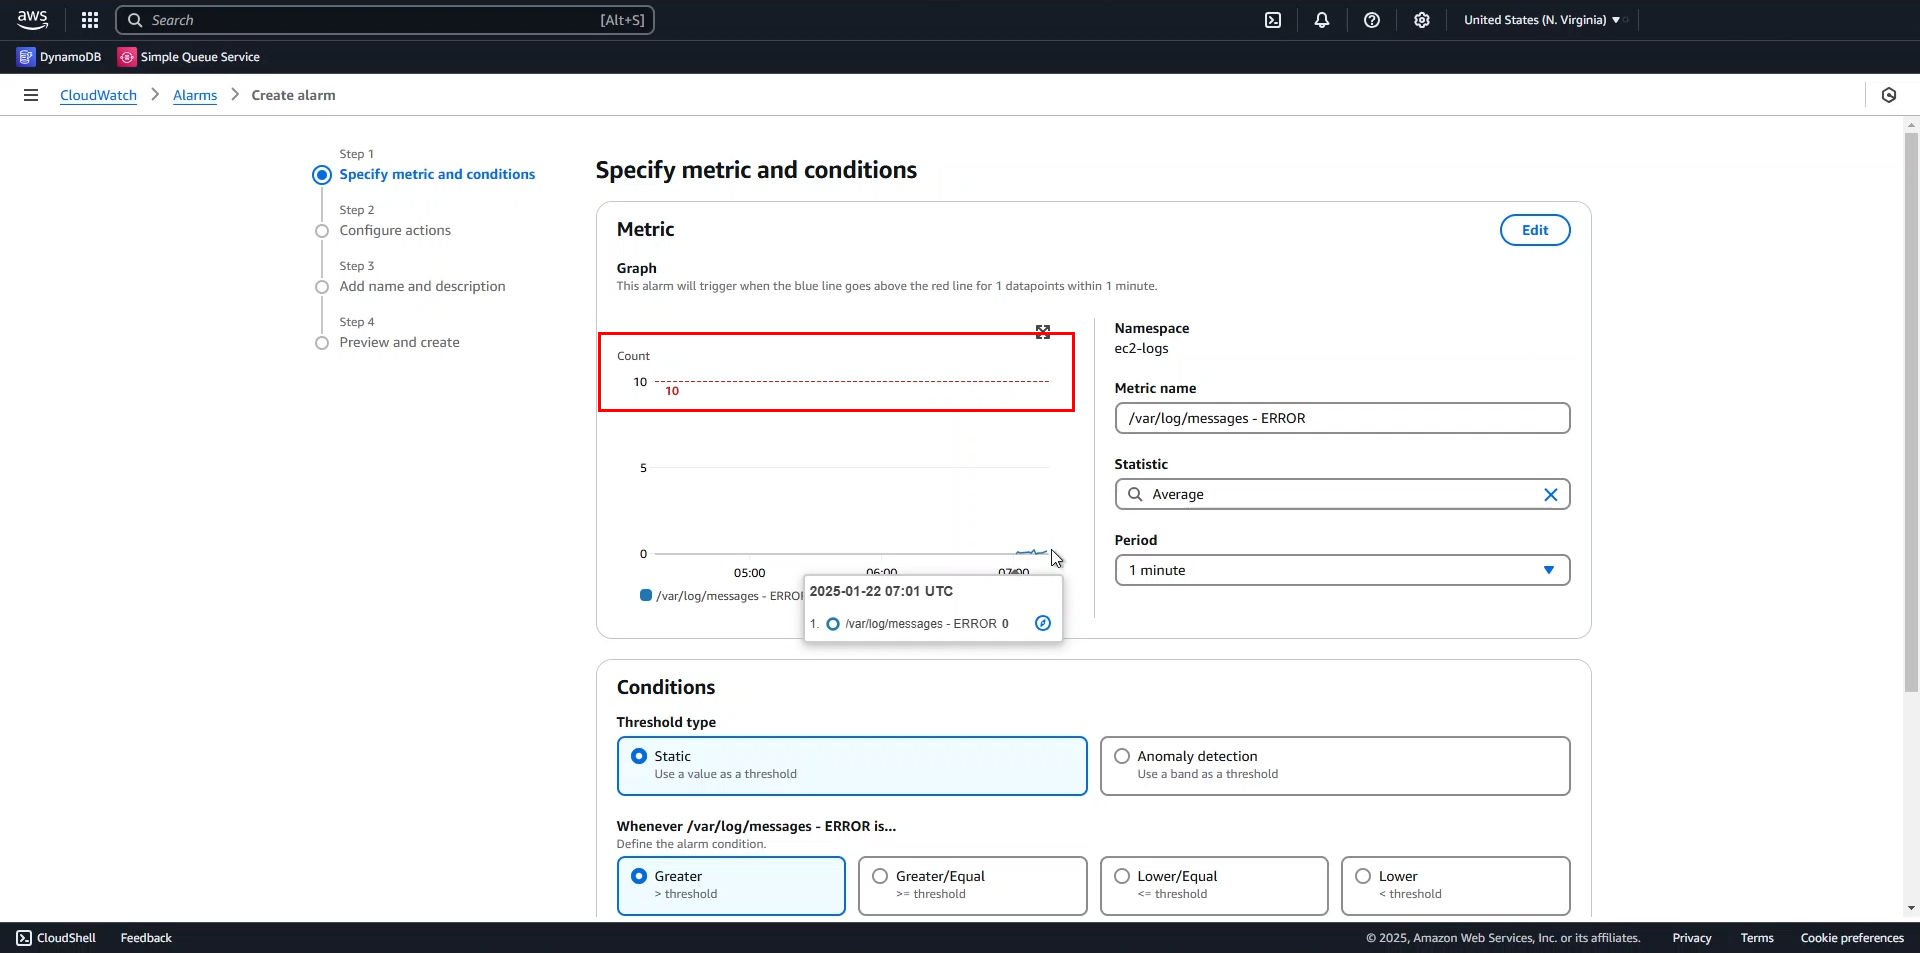
💡 Pro Tip: The dashed line represents your threshold boundary. When the metric crosses this line, the alarm will transition to the ALARM state, indicating unusual application behavior that requires immediate investigation.
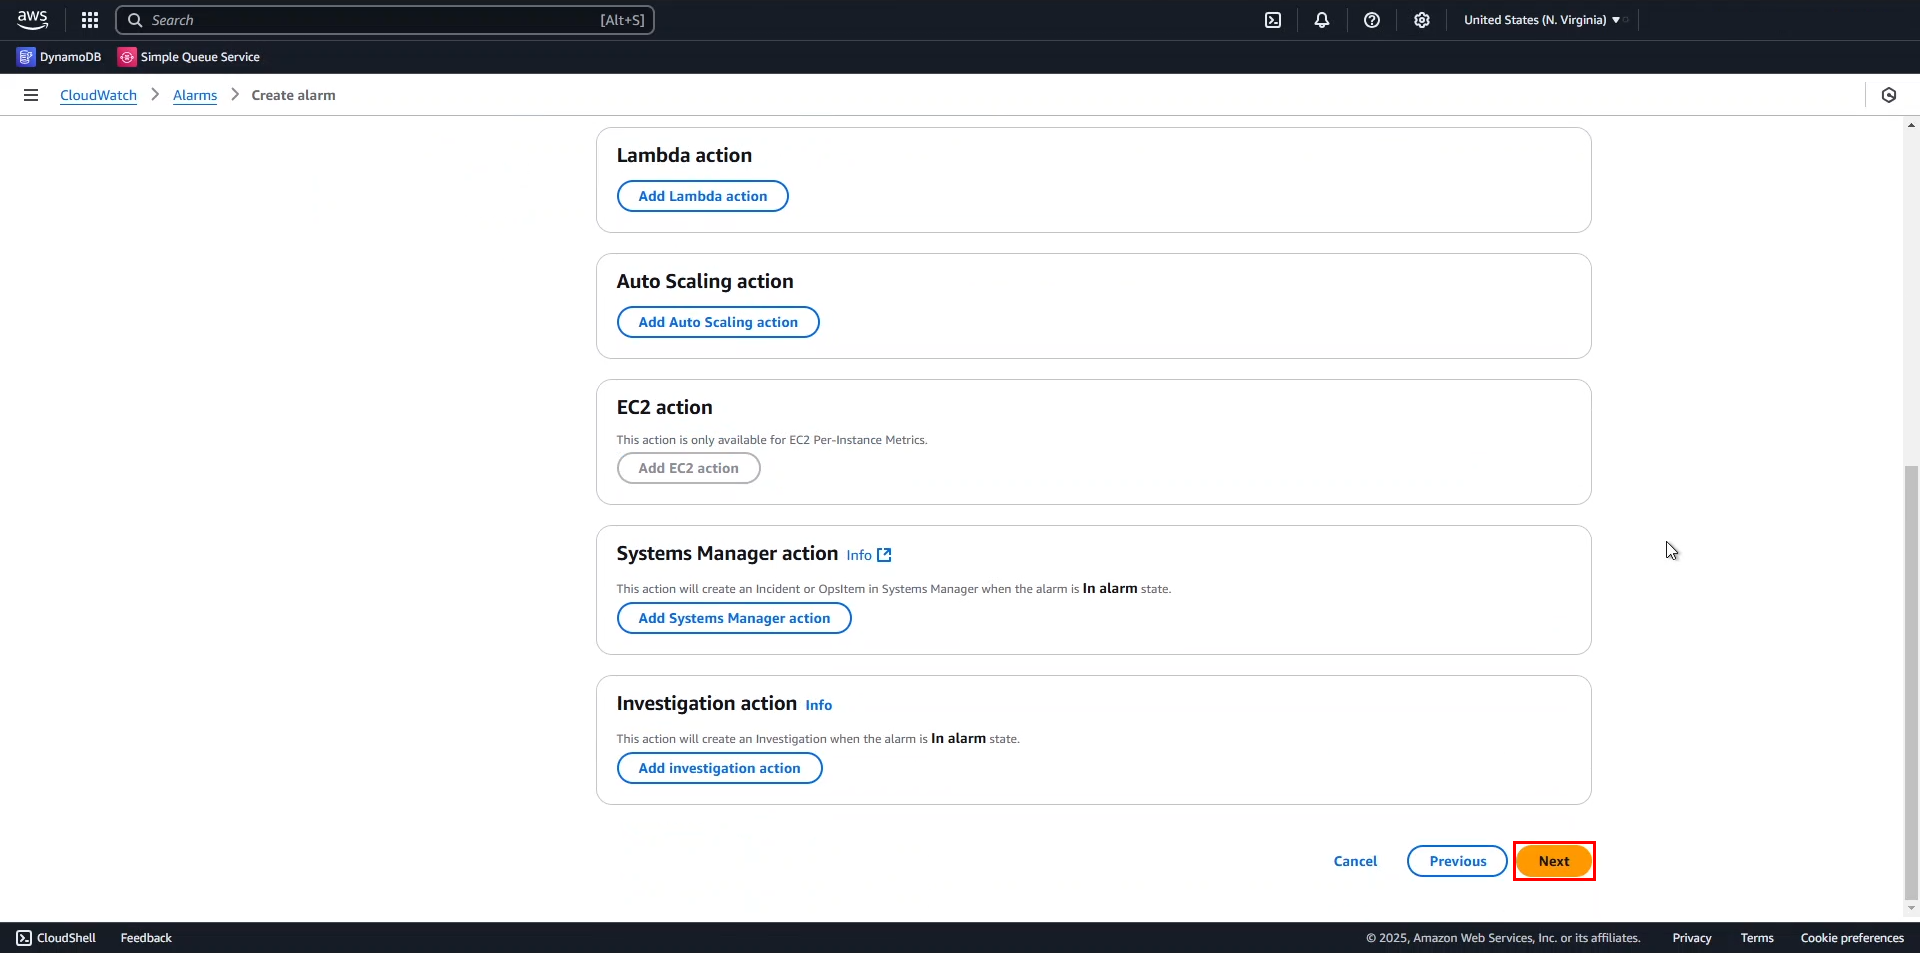
- Click Next to continue
-
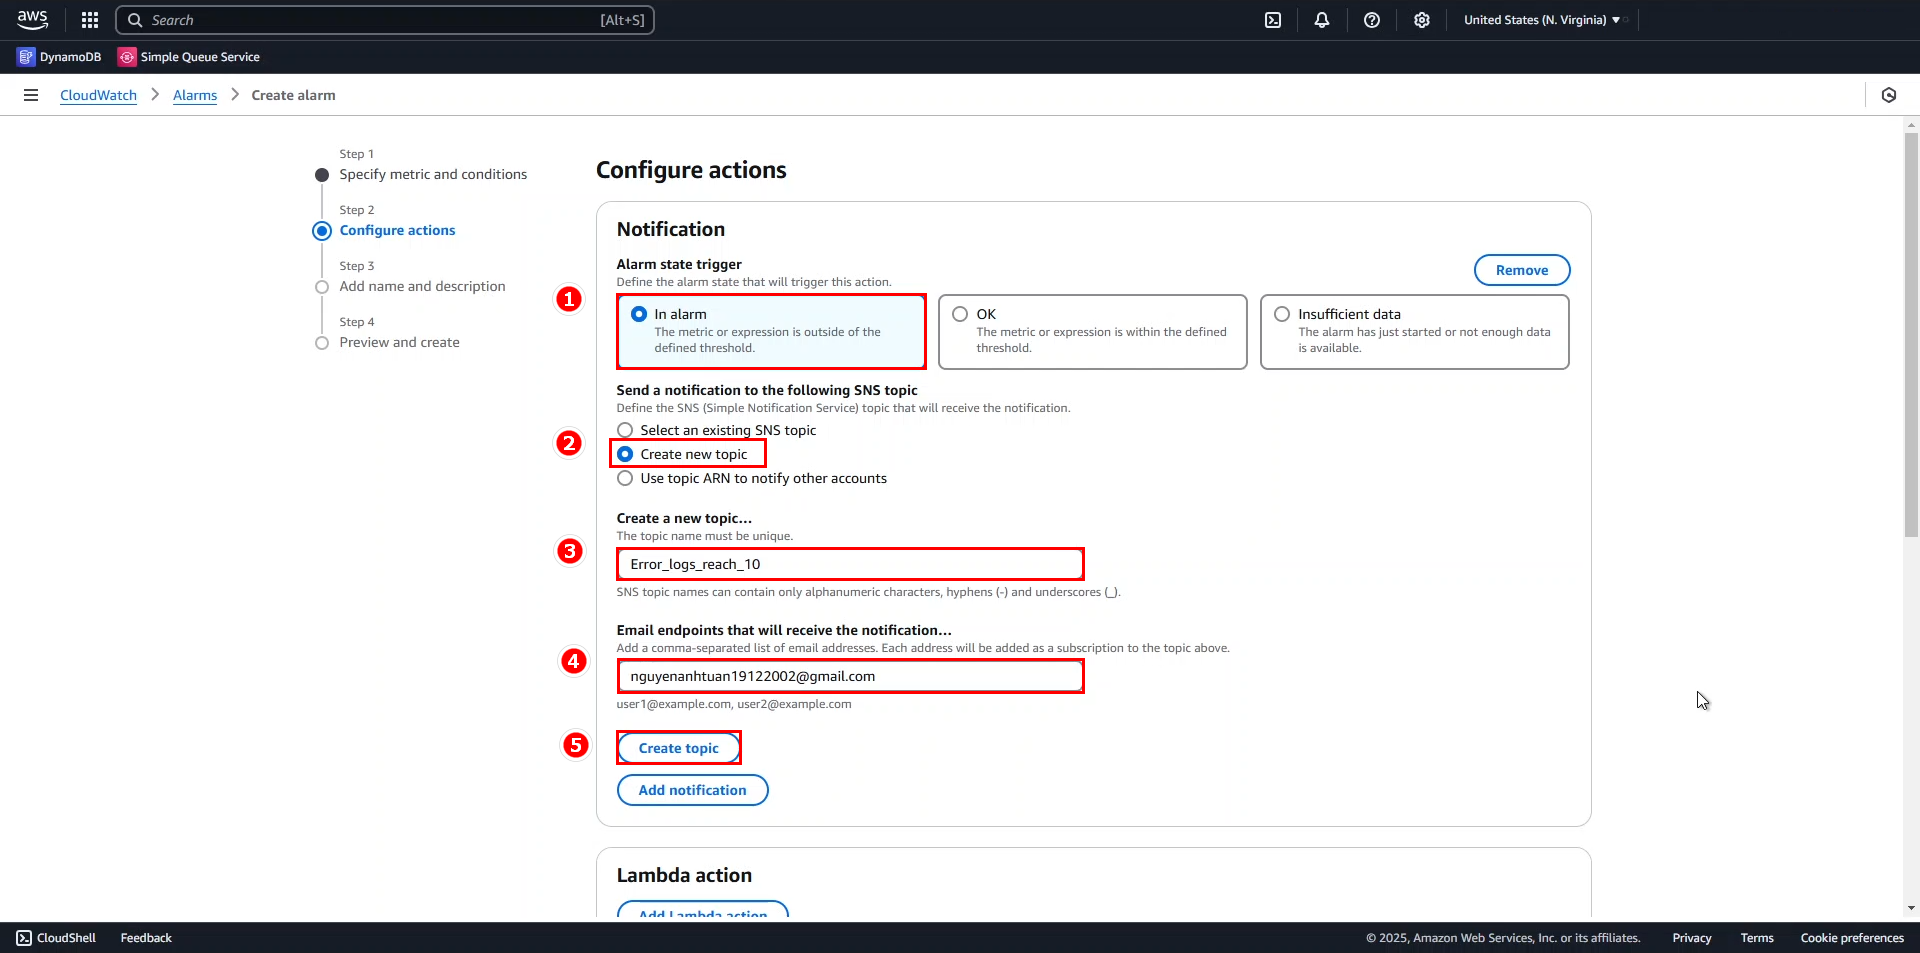
Configure notification settings:
- Alarm state trigger: In alarm
- Select Create new topic
- Topic name:
Error_logs_reach_10 - Email to notify: enter your email address
- Click Create topic
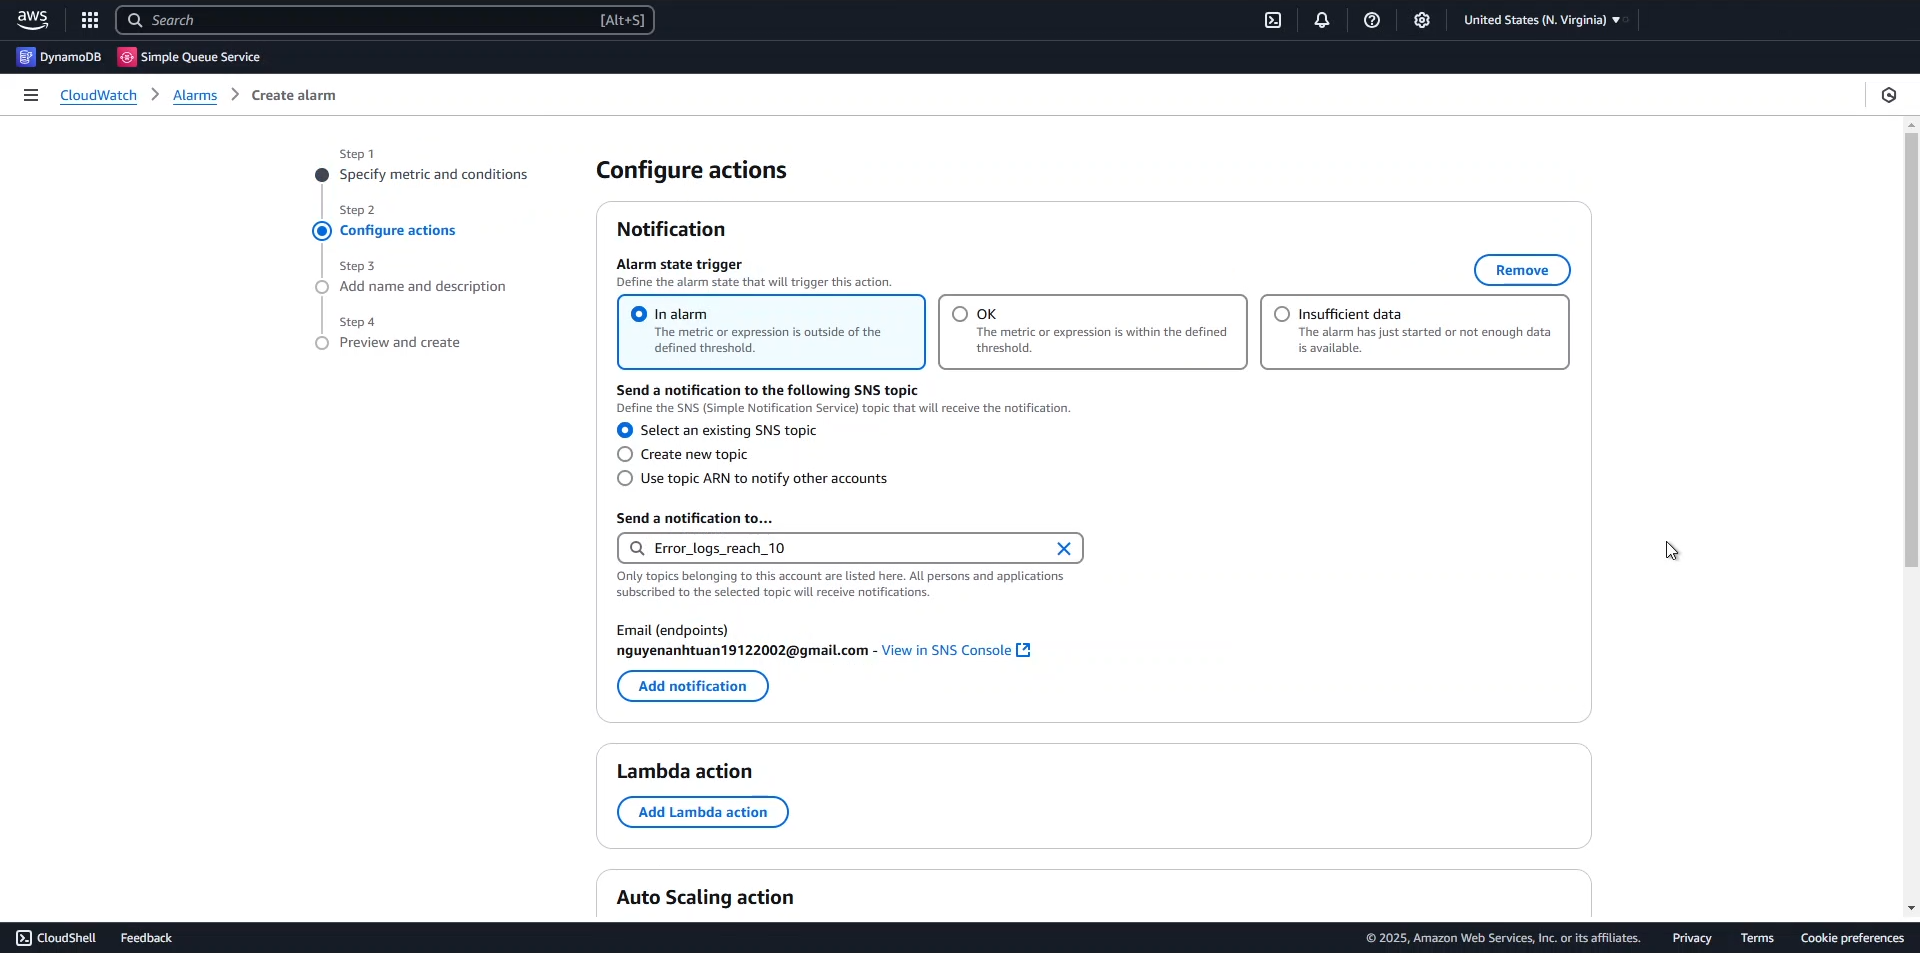
- Click Next
-
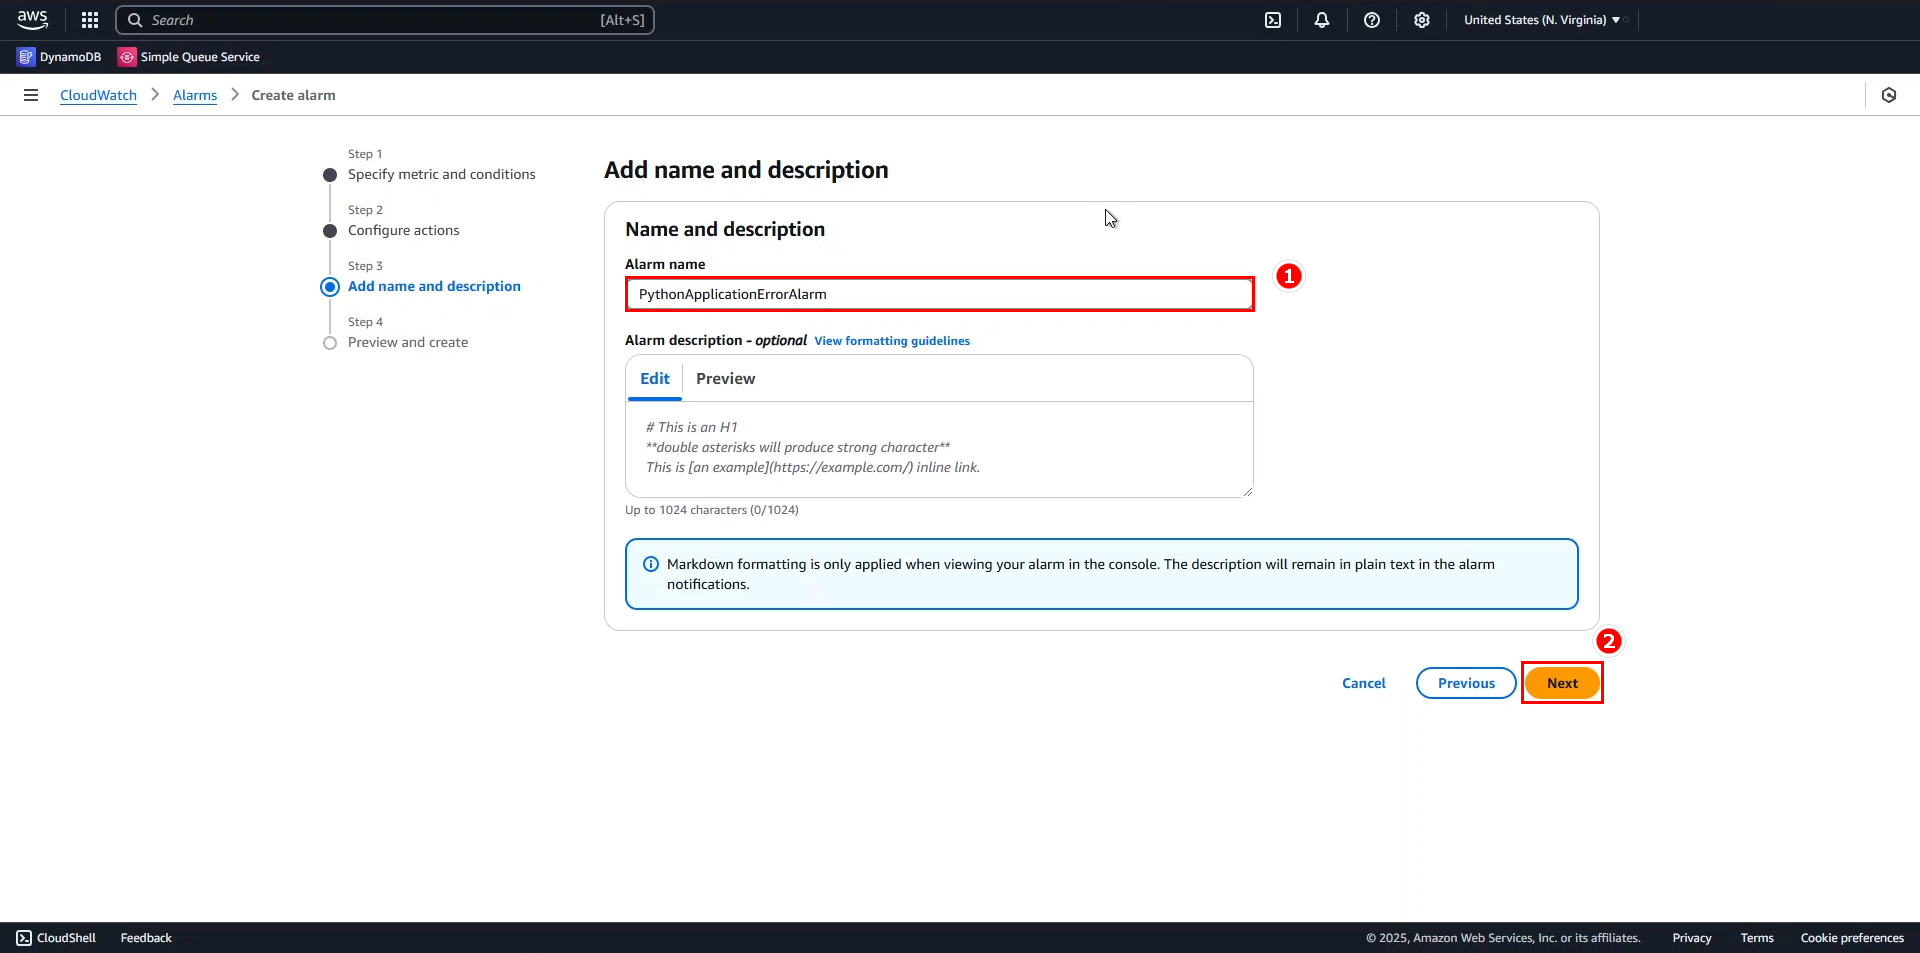
Name your alarm:
- Enter alarm name:
PythonApplicationErrorAlarm - Click Next
- Enter alarm name:
-
Review and create:
- Verify all configurations
- Click Create alarm
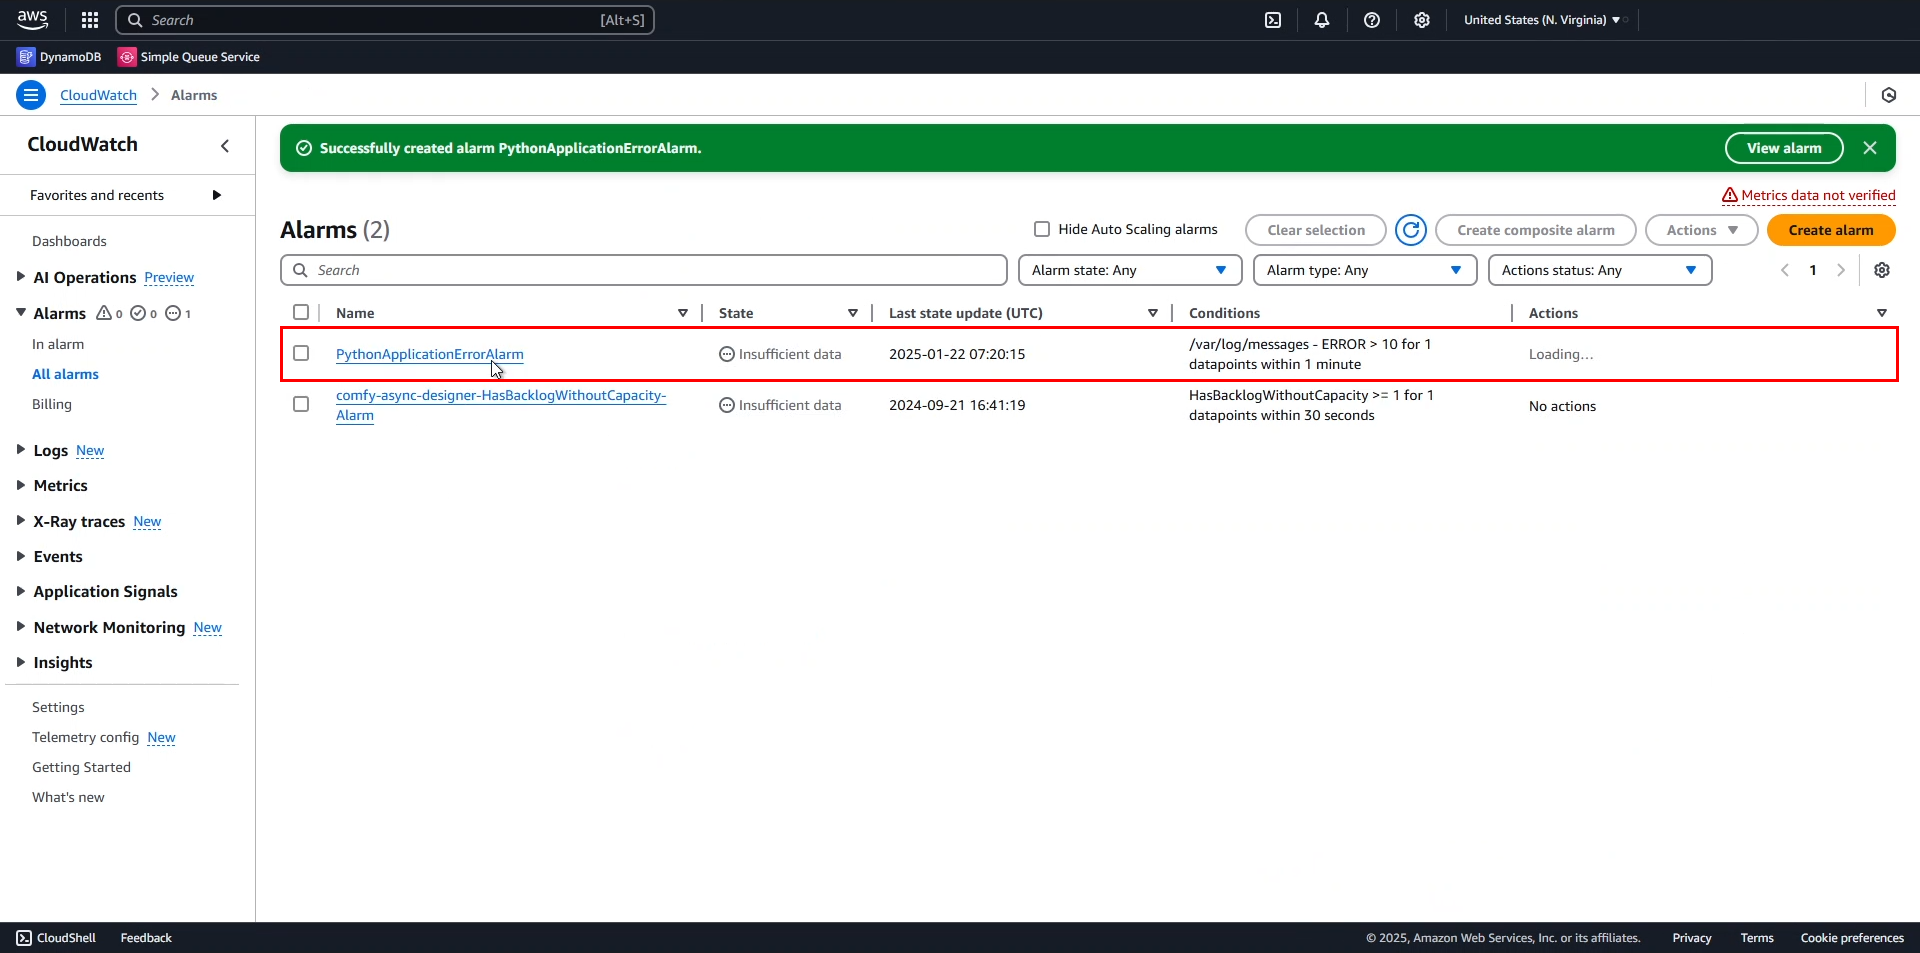
⚠️ Warning: Your alarm will remain in the INSUFFICIENT_DATA state until Amazon SNS confirms your subscription and the metric receives data points.
-
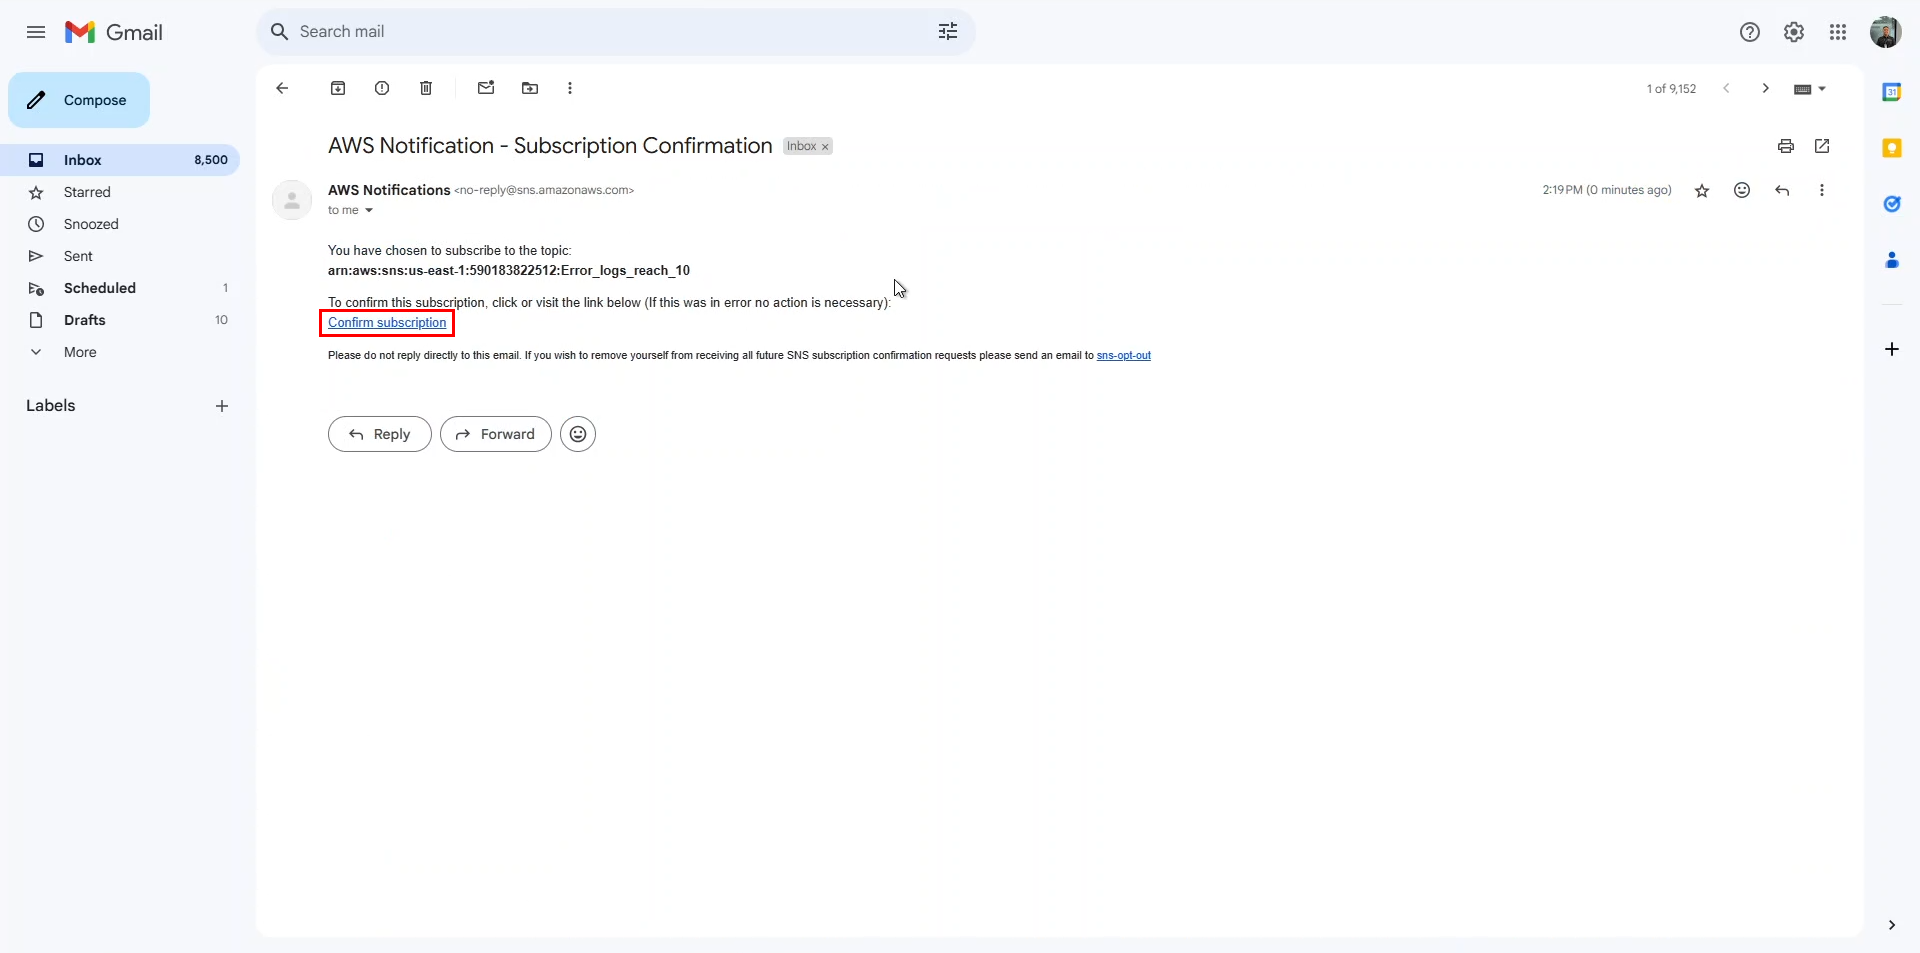
Confirm your SNS subscription:
- Check your email for a message from AWS Notifications
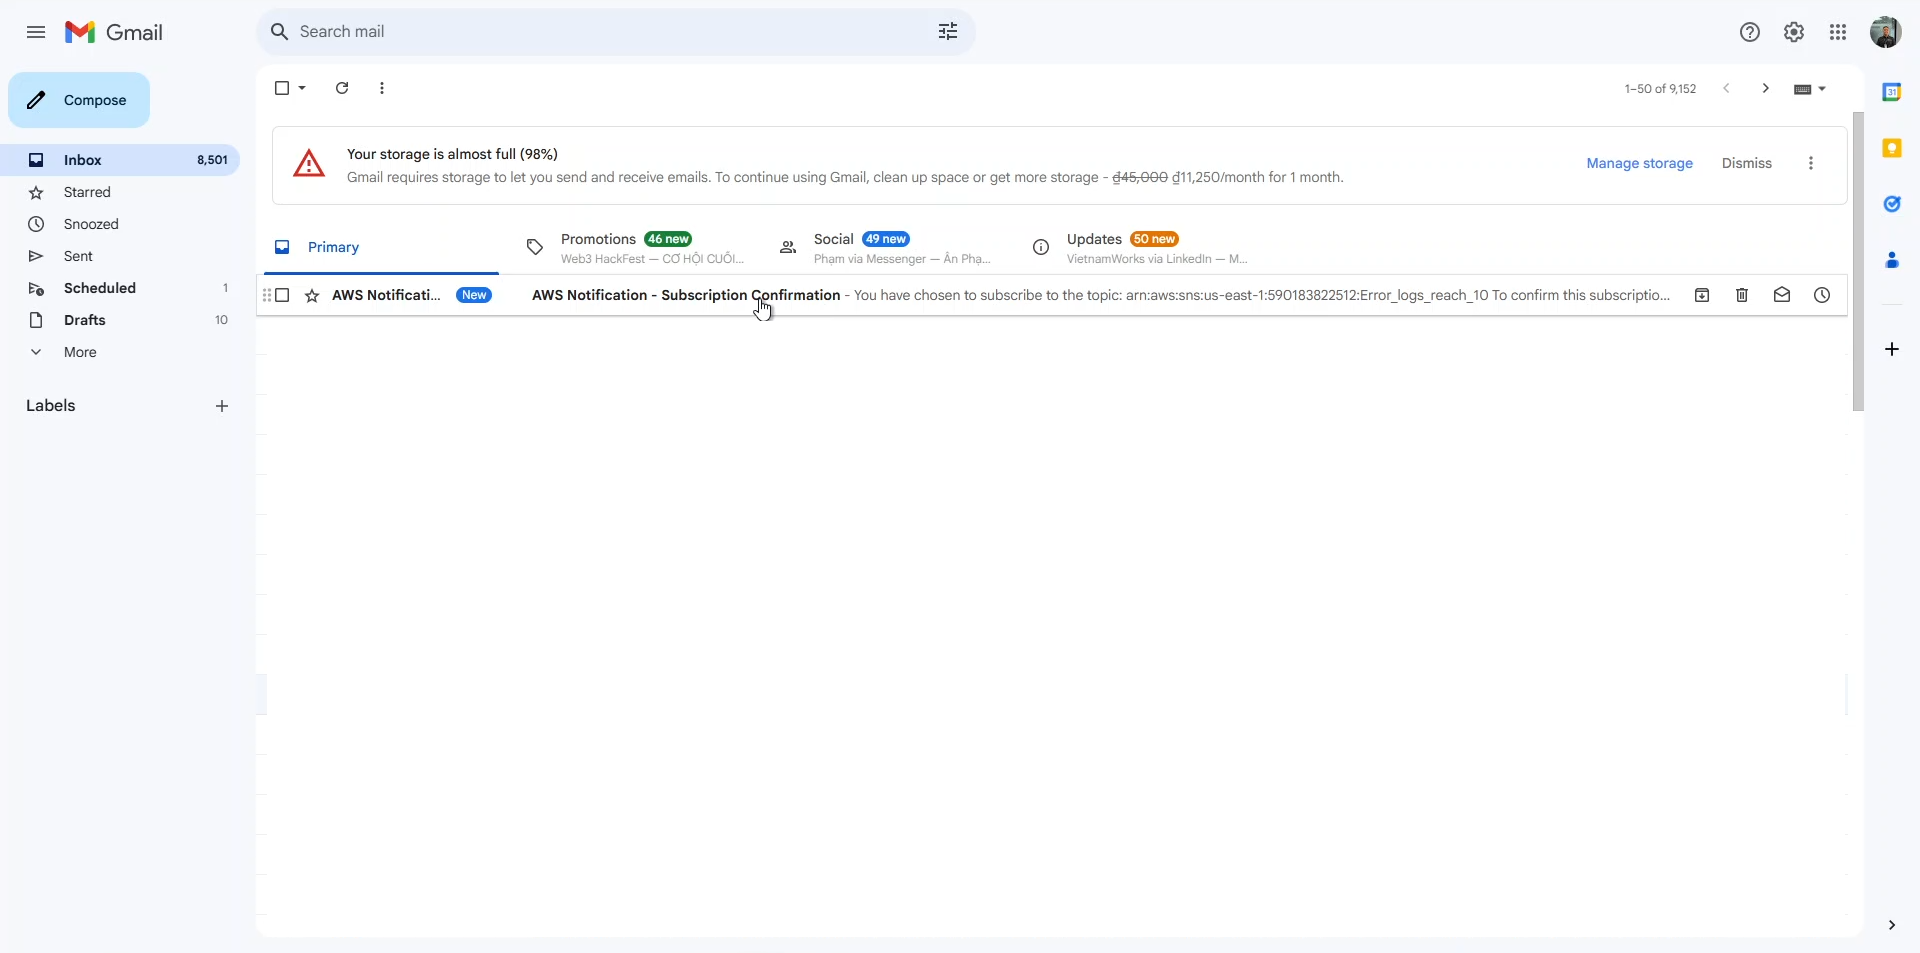
- Click Confirm subscription
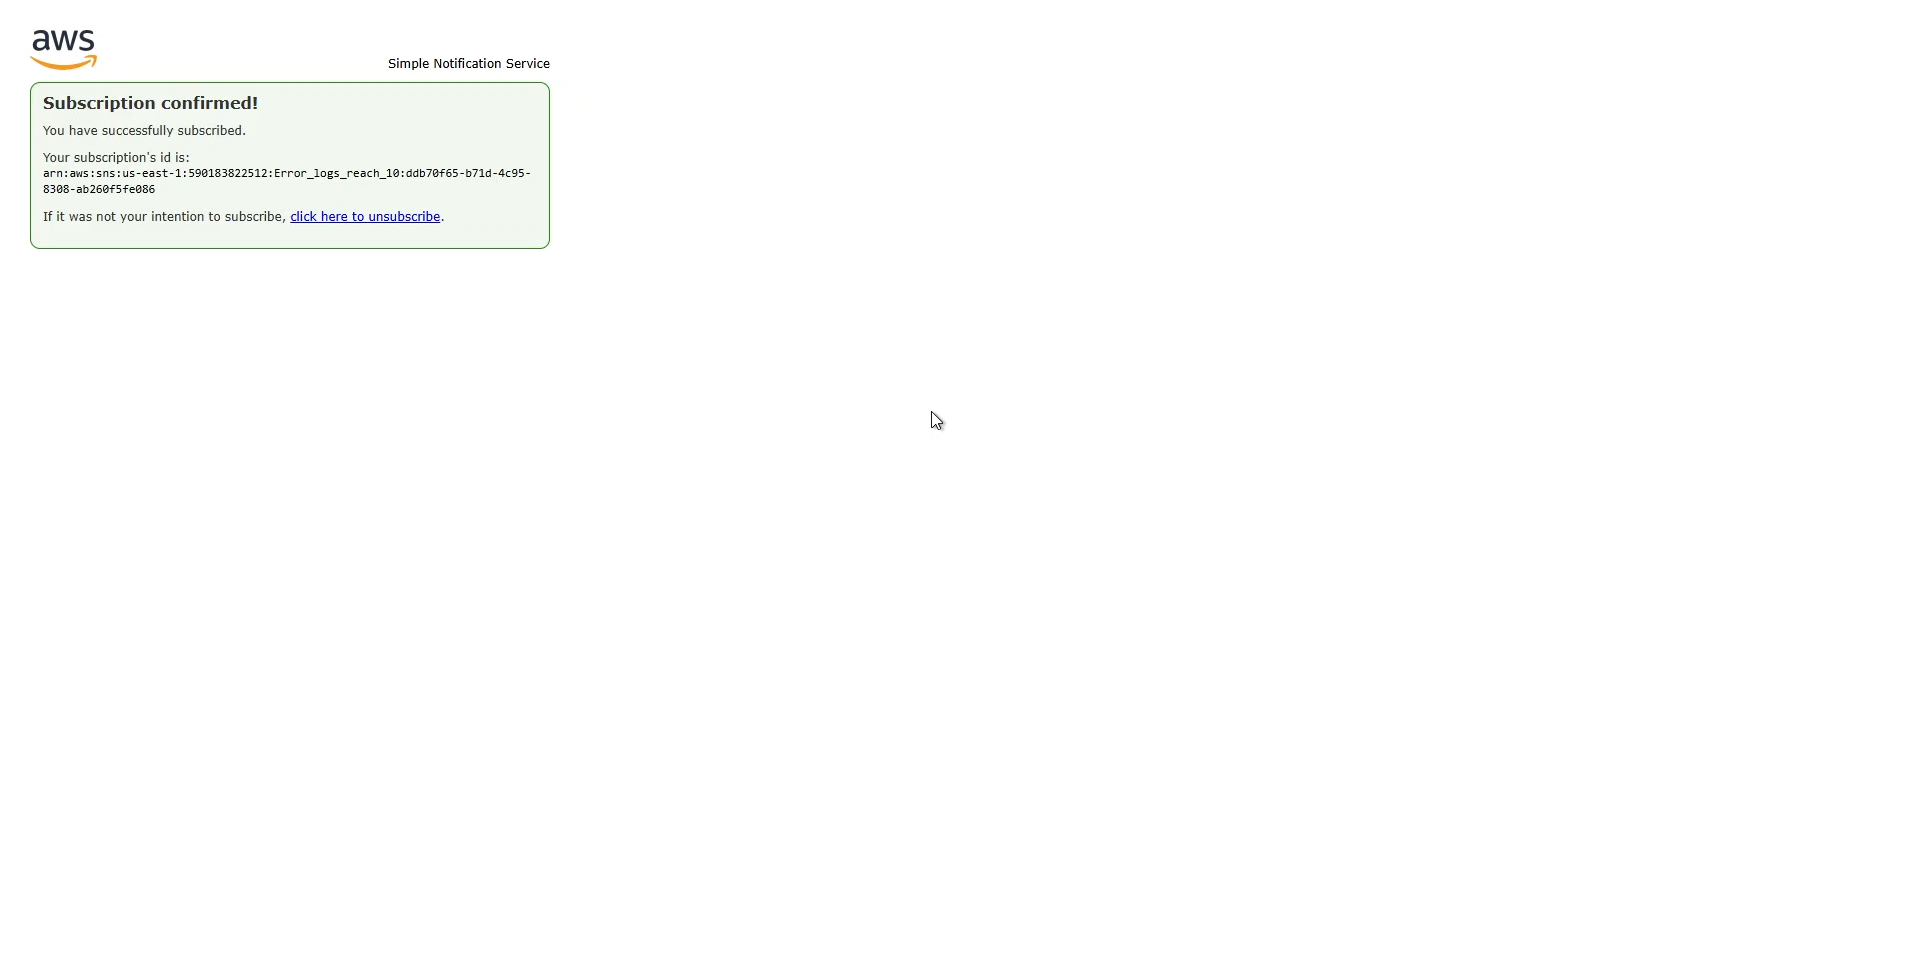
🔒 Security Note: Always confirm SNS subscriptions promptly to ensure you receive critical alerts. Consider using Amazon SNS with AWS Lambda for automated remediation of issues detected by CloudWatch Alarms.
Your CloudWatch Alarm is now fully configured and will monitor your application for error spikes, notifying you when the threshold is exceeded.