AWS CloudWatch Workshop

Overview
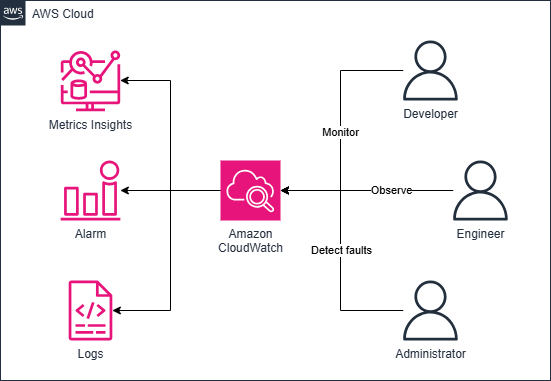
ℹ️ Information: Amazon CloudWatch is a comprehensive monitoring and management service that provides data-driven insights for AWS resources, hybrid, and on-premises applications. It enables you to collect and analyze performance and operational data through unified logs and metrics, eliminating siloed monitoring approaches across servers, networks, and databases. CloudWatch facilitates end-to-end observability across your applications, infrastructure, and services while enabling automated actions based on alerts, logs, and events to reduce mean time to resolution (MTTR). This powerful service allows you to redirect valuable resources toward application development and business innovation.
CloudWatch delivers actionable insights that help optimize application performance, efficiently manage resources, and maintain visibility into system health. The service provides high-resolution metric and log data with one-second granularity, retains metric data for 15 months, and supports advanced metric calculations. CloudWatch enables cost optimization through historical data analysis while providing real-time information to fine-tune application and infrastructure resources.
💡 Pro Tip: CloudWatch Container Insights offers specialized monitoring capabilities for containerized applications and microservices. It automatically collects, aggregates, and summarizes key compute metrics (CPU, memory, disk, network) and diagnostic information (such as container restart failures), enabling DevOps teams to quickly identify and resolve issues. Container Insights provides visibility into various container orchestration platforms including Amazon EKS (Elastic Kubernetes Service), Amazon ECS (Elastic Container Service), AWS Fargate, and self-managed Kubernetes clusters.